
Subscription businesses are everywhere. 24% of U.S. companies offer products or services running on recurring revenue. But 48% of these businesses wrestle with accounting headaches. Tracking deferred revenue, keeping billing in sync with financial records, and making sense of the numbers is a constant challenge.
Now picture a system that automates billing, syncs financial records, and stops revenue from falling through the cracks. That’s what subscription management software provides—enabling businesses to keep tabs on subscription changes, recover failed payments, track revenue with ease, and grow without operational upheaval.
Here, we’ll examine the optimal software to oversee this complex process.
Key takeaways:
If you’re just looking for a summary, here’s a brief account of what matters most when choosing and implementing subscription management software.
- Choosing the correct subscription management software is essential to SaaS business growth. The right platform simplifies billing, prevents churn, and keeps financial information current, reducing manual processing and improving cash flow.
- A robust subscription management platform optimizes the whole revenue cycle. Automated billing, real-time reporting, and dynamic pricing models enable companies to scale successfully.
- Each subscription management tool has unique strengths, making it important to find the right fit. Some are revenue recognition and compliance focused, while others are churn prevention and payment integration-friendly—companies will have to select according to their requirements.
- Implementing a subscription management solution requires careful planning. Defining a billing strategy, integrating payment gateways, automating financial processes, and tracking key performance metrics are must-do tasks in order to achieve peak efficiency.
Having discussed our key takeaways, we move on to what constitutes a good solution for managing SaaS subscriptions.
Main features of a powerful subscription management platform
The correct subscription management software is all about creating an accurate and scalable recurring revenue recognition process while keeping customers engaged. It’s something that will perform all the recurring revenue tasks in the background while you concentrate on expansion. This is what you need to be searching for:
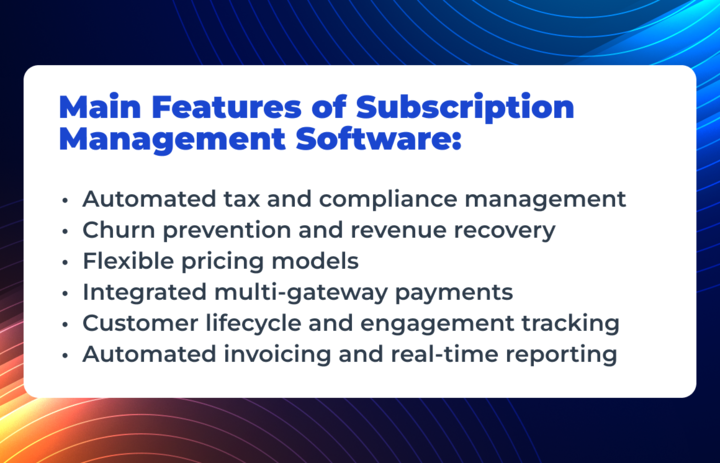
- Automated tax and compliance management: Maintains compliance with standards like GAAP, SOC 2 and GDPR, minimizing the risk of audit and legal issues.
- Automated recurring billing: Prevents missed payments and manual updates by automatically managing renewals, upgrades, and plan changes.
- Churn prevention and revenue recovery: Leverages smart payment retries, dunning management, and predictive analytics for customer retention and reducing revenue loss.
- Flexible pricing models: Supports tiered, usage-based, or hybrid pricing structures, enabling easy adjustments without ongoing developer involvement.
- Integrated multi-gateway payments: Enables customers to make payments through different processors such as Stripe and PayPal, supporting multiple currencies and locations with ease.
- Customer lifecycle and engagement tracking: Monitors service usage to identify churn risks and apply data-driven strategies for improved retention.
- Automated invoicing and real-time reporting: Offers accurate billing, revenue monitoring, and real-time financial information for making informed decisions.
Learn about revenue recognition challenges for subscriptions and how to handle them with automation.
Now, let’s look at the top solutions that are getting it right.
Top 10 SaaS subscription management platforms
The key to managing recurring revenue as a SaaS business is accounting for revenue appropriately—ensuring revenue is recognized when earned, not just when payments are received—required to remain compliant and obtain a good snapshot of financial health. Add in billing, invoicing, and notifying customers, and it can all become quite complex. That’s where automation comes in.
1. Synder
Synder doesn’t just record Stripe subscription payments—it handles accounting, tracks taxes, ensures revenue recognition compliance, and keeps everything in sync. Whether you charge monthly, annually, or by usage, it takes care of the details so you don’t have to rely on spreadsheets or manual work.
Why SaaS businesses choose Synder:
✅ Hassle-free revenue recognition. No more guessing when it comes to revenue recognition. Synder simplifies deferred revenue tracking and recognizes it according to GAAP & ASC 606 guidelines, so you’re always audit-ready.
✅ Automated invoicing – Forget manual invoicing and payment chasing. Synder automatically generates invoices for subscriptions, one-time fees, and upgrades, so your customers are charged right at the right time.
✅ Seamless payment integration – Process payments via Stripe, PayPal, Square, or other gateways, and Synder will sync all the fees, refunds, and charges to your accounting system (Sage Intacct, QuickBooks, or Xero) automatically.
✅ Multicurrency support – Synder automatically posts transactions in different currencies and converts them to your home currency, providing precise financial reporting for different markets.
✅ Clear financial insights – Receive real-time MRR, ARR, deferred revenue, etc., reports so that you can make business decisions with confidence and forecast revenue.
✅ Subscription lifecycle made simple – No matter if a customer upgrades, downgrades, suspends, or cancels, Synder automatically updates your books without any manual effort.
✅ Automated tax & reconciliation – Stay compliant with VAT, sales tax, and more, as Synder reconciles every payment correctly in your books.
Takeaway: Synder offers SaaS founders, CFOs, and finance teams accurate books, automated GAAP-compliant revenue recognition, and simple subscription management—all within a single tool.
Experience Synder in action—sign up for a 15-day free trial or book a spot at our Weekly Public Demo to learn how Synder can benefit your business.
2. Chargebee
Chargebee assists SaaS companies in growing with automated billing, tax compliance, and retention software. Regardless of whether you provide monthly, yearly, or usage-based plans, Chargebee keeps payments seamless and revenue predictable.
Why SaaS businesses choose Chargebee:
✅ Churn prevention & revenue recovery – AI technology minimizes cancellations and recovers failed payments.
✅ Flexible pricing & discounts – Quickly manage customer subscriptions, changing plans, promotions, and billing cycles without coding.
✅ Seamless payment integration – Accept payments from anywhere in the world through Stripe, PayPal, and more, all reconciled with accounting.
✅ Automated tax compliance – Streamline VAT, sales tax, and regulation management.
✅ Real-time revenue insights – Track MRR, ARR, churn, and deferred revenue through integrated reporting.
Takeaway: Chargebee simplifies subscription billing and financial management so that you can concentrate on growth.
3. Recurly
Recurly provides SaaS businesses with an intelligent way to handle subscriptions through AI-driven insights, fraud protection, and adaptive billing solutions, aimed at optimizing revenue and reducing churn.
Why SaaS businesses choose Recurly:
✅ Smart churn prevention – Uses machine learning to detect at-risk customers and improve retention.
✅ Automated payment recovery – Advanced dunning management retries failed transactions and notifies customers proactively.
✅ Flexible pricing & promotions – Supports tiered, metered, and add-on pricing to accommodate any subscription model.
✅ Revenue forecasting & analytics – Provides real-time insight into subscriber growth, revenue trends, and churn rates.
Takeaway: With Recurly, SaaS businesses can boost retention, enhance cash flow, and make subscription billing easier, while staying ahead with AI-powered automation.
4. Zuora

Zuora is designed for enterprise SaaS businesses that require a scalable, automated billing solution to manage sophisticated pricing, revenue recognition, and contract management. With deep integrations and AI-driven forecasting, Zuora streamlines the management of high-volume subscriptions.
Why businesses choose Zuora:
✅ Comprehensive subscription lifecycle management – Automates everything from sign-ups to renewals for seamless operations.
✅ AI-Driven revenue recognition – Offers GAAP-compliant revenue tracking and forecasting accuracy.
✅ Enterprise-level integrations – Syncs effortlessly with ERP, CRM, and accounting tools for a unified financial system.
✅ Custom pricing & contract automation – Supports multi-tiered pricing, metered billing, and complex contracts with built-in flexibility.
Takeaway: Zuora simplifies billing, reduces manual intervention, and optimizes revenue streams, making it the go-to option for businesses dealing with high-growth subscription models.
5. Paddle
Paddle is built for SaaS companies seeking a unified platform billing and payments solution, managing subscriptions, taxes, and compliance simultaneously. With fraud protection included out of the box and automatic tax handling, Paddle takes away the pain of selling software overseas.
Why SaaS businesses choose Paddle:
✅ Unified billing & tax compliance – Automatically handles EU VAT/sales tax, checkout, and subscriptions.
✅ Hassle-free global expansion – Supports multicurrency payments without the need for separate payment processors.
✅ Built-in churn prevention – Recovers lost revenue with smart payment retries and fraud protection.
✅ No-code pricing adjustments – Easily update plans, discounts, and pricing models without engineering resources.
Takeaway: With Paddle, SaaS businesses can sell globally, minimize administrative headache, and optimize subscription revenue, without having to juggle numerous third-party tools.
6. Stripe Billing
Stripe Billing is a nice option for SaaS businesses looking for seamless subscription management and payment processing automation. With built-in tools for recurring billing, invoicing, and payment retries, it simplifies revenue collection for businesses of any size.
Why SaaS businesses choose Stripe Billing:
✅ Built-in subscription flexibility – Supports monthly, annual, and metered billing models for scalable pricing.
✅ Seamless payment integration – Integrates natively with Stripe Payments, enabling simple setup and global transactions.
✅ Automated invoicing & dunning – Recovers failed payments with intelligent retry logic, enhancing cash flow.
Takeaway: Stripe Billing is a good fit for companies already on Stripe, with an easy, developer-focused approach to scaling subscriptions without complex integrations.
7. Billsby
Billsby is designed for SaaS businesses that require extremely flexible billing and subscription automation minus the hassle of enterprise software. With its no-code configuration, plans, pricing, and customer experience with billing can be easily tailored.
Why SaaS businesses choose Billsby:
✅ Highly customizable subscription management – Supports tiered, metered, and add-on pricing without requiring coding.
✅ Advanced dunning & payment recovery – Reduces churn by automating retries and reminders for failed payments.
✅ Seamless integrations – Integrates with CRM, payment gateways, and accounting software for seamless operations.
Takeaway: Billsby allows SaaS businesses to simplify price model updates, maximize payment success, and manage subscriptions effortlessly without technical burden.
8. Maxio
Maxio (previously Chargify & SaaSOptics) pairs billing automation with in-depth analytics, making it an excellent choice for growing SaaS businesses. Featuring strong financial reporting, subscription lifecycle management, and revenue forecasting, Maxio enables finance teams to make informed decisions.
Why SaaS businesses choose Maxio:
✅ Automated billing & subscription management – Effortlessly manages recurring revenue, pricing updates, and renewals.
✅ Advanced financial analytics – Monitors MRR, ARR, churn, and deferred revenue for more informed decision-making.
✅ Seamless integrations – Syncs with accounting software, ERPs, and payment processors for complete financial data.
Takeaway: Maxio is built for SaaS companies that need deep financial insights and automated subscription billing, making it a robust revenue optimization solution.
9. ChargeOver
ChargeOver simplifies subscription billing by automating recurring payments, invoicing, and customer account management. ChargeOver is built for businesses requiring a straightforward, dependable billing system, and it minimizes manual effort while speeding up cash flow.
Why SaaS businesses choose ChargeOver:
✅ Automated recurring billing & invoicing – Facilitates timely payment and correct financial recording.
✅ Customizable subscription plans – Provides fixed, metered, and tiered pricing to suit any business model.
✅ Flexible payment integrations – Supports credit cards, ACH, and payment gateways for convenient payments.
Takeaway: With ChargeOver, businesses can minimize manual billing, streamline payment collection, and simplify recurring revenue management in an easy-to-use platform.
10. FastSpring
FastSpring is an all-in-one subscription platform for SaaS companies selling digital products worldwide. Through localized pricing, automated tax management, and revenue recovery features, it makes global sales and compliance easier.
Why SaaS businesses choose FastSpring:
✅ Localized billing & currency support – Accepts payments in various currencies and languages for international reach.
✅ Built-in tax & compliance automation – Automatically manages VAT, sales tax, and global regulations.
✅ Revenue recovery tools – Minimizes lost revenue with intelligent payment retries and fraud prevention.
Takeaway: FastSpring is perfect for SaaS businesses selling globally, assisting businesses in automating compliance, making pricing simple, and optimizing worldwide revenue.
How to effectively implement a subscription management solution
Implementing a subscription management platform needs to be well planned so that it addresses your business requirements and customer expectations. Here’s how you can do it effectively, with examples from real life:
1. Decide on your billing policy
Not all customers fit into one pricing model. Offering tiered, usage-based, or hybrid pricing enables companies to target various customer segments and achieve the highest potential revenues.
2. Provide payment flexibility
Customers expect seamless payment experiences across different regions and currencies. Supporting multiple payment gateways like Stripe, or PayPa ensures smooth transactions for a broader customer base.
For example, an online subscription service can use Synder to integrate multiple payment gateways, allowing users to pay in their preferred currency, reducing payment failures and increasing conversions.
3. Optimize churn management
Involuntary churn caused by payment failure and expired billing details can significantly impact revenue. Automated dunning workflows, retries of failed payments, and proactive customer notifications reclaim revenue and retain subscribers.
4. Monitor performance metrics
Tracking MRR, ARR, churn, and customer lifetime value (CLV) helps businesses pinpoint trends and make data-informed decisions to influence customer retention and pricing models alike.
For instance, a subscription-based HR platform can utilize Synder to receive real-time customer behavior and revenue pattern insights to refine their customer interaction process and enhance retention.
In short, seamless implementation helps companies get the most out of their subscription management software.
Why subscription management software is a game-changer
A subscription management platform removes the pain from financial operations.And the following are some important reasons why.
Revenue stability & predictability
Automated billing prevents late payments, ensuring steady cash flow and reliable financial planning. Imagine a cloud storage SaaS that serves businesses worldwide. Instead of chasing overdue invoices, the company can use automated billing and reminders to ensure payments are processed on time. This consistency will allow them to focus on improving their infrastructure rather than dealing with missed revenue.
Seamless user experience
Billing should be effortless. Subscription software ensures smooth transactions, supports multiple payment gateways, and reduces account disruptions. Take a fitness app with subscribers from around the world. If the users are on the road and their payments are rejected due to location-based security blocks, an automated payment retry system will keep them from losing access to their workouts, keeping them engaged and reducing cancellations.
Scalability without complexity
Subscription software automates billing, tax compliance, and multi-currency support, making it easier to scale. Consider the case of a language-learning app that’s acquiring thousands of new customers every month. Without automation, managing different pricing tiers, currencies, and tax rules would require a huge support team. By automating these processes, the company can continue growing without unnecessary operational burdens.
Final thoughts
Managing subscription services starts simple but becomes a headache all too quickly—failed payments, churn, and revenue tracking can spiral out of control. Subscription management software takes this headache away from companies by automating billing, revenue recognition, and customer retention so you can be sure nothing falls between the cracks. This sort of software remembers when to charge, re-attempts failed payments without irritating your customers, and gives you an easy view of your revenue in real time.
This is what tools like Synder bring to the table. It’s not merely automation, but control over your finances and the possibility to scale without chaos.
For more insights, check out our article on SaaS accounting essentials.