

As a business owner, you likely recognize the vital role financial statements play in monitoring operations, attracting investors, and securing loans.
A profit & loss (P&L) statement is one of the three pillars of financial reporting. Let’s take a closer look at what a P&L is, how exactly it works, why your business needs it, and the way automatic accounting software can help you create it.
Key takeaways
- The components of a P&L statement are revenue, cost of goods sold, gross profit, operating expenses, operating income, and net income.
- There are different formats of a P&L statement: single-step, multi-step, condensed, and common-size.
- A business may prepare P&L statements using the cash or accrual accounting method.
In this article we’ll take a closer look at:
3. Methods to prepare a P&L statement
4. What is the P&L statement formula?
6. An automated P&L statement with Synder
7. How Synder creates a P&L statement
8. FAQs
What is a P&L statement?
A P&L statement is a financial report that records a business’s revenues, expenses, and profits/losses within a given period of time. From it, you can observe the business’s progress and trends that will assist you in identifying strengths that lead to success and weaknesses that require focus. In other words, this type of financial statement gives information about how much your business is making or losing.
P&L statements must follow specific GAAP rules to keep the financial information accurate and reliable. These guidelines help make sure that revenues, expenses, and profits or losses are recorded and presented in a consistent way. Understanding these principles enables you to make the right business decisions and record the financial transactions correctly.
Income statement vs. P&L: Are they the same?
Yes. An income statement and a P&L statement refer to the same financial report. There’s no difference between them. While there are other names for this report, these are the most common ones:
- expense statement,
- earnings statement,
- statement of operations,
- or statement of financial results.
Whether called the income statement or the statement of profit and loss, the main idea is that the P&L statement is one of the primary sources of information about your company’s financial position.
Types of P&L statements
There are several formats that a P&L statement can follow. This largely depends on the size of the firm, the nature of its operational structure, and the nature of the reports it needs to produce. Now, let’s take a look at the most common ones, which should be interesting.
1. Single-step
The single-step format is the simplest one. It classifies all the revenues and gains in one place and all the expenses and losses in another. It’s suitable for companies that are small or those that don’t have complicated processes.
Single-step P&L statement example
If you’re a cake maker and you’ve got your own bakery, here’s how your P&L statement might look like:
Sweet Treats Bakery
Income Statement
For the year ended December 31, 2023
| Category | Amount |
| Revenue | $60,000 |
| Expenses | |
| – Ingredients | $12,000 |
| – Packaging | $1,200 |
| – Cake boxes | $1,500 |
| – Delivery costs | $2,500 |
| – Advertising | $3,000 |
| – Insurance | $1,200 |
| – Interest expense | $300 |
| – Taxes | $9,575 |
| Total expenses | $32,275 |
| Net income | $27,725 |
2. Multi-step
The multi-step format provides a more detailed view because it separates operating revenues and expenses from non-operating ones. It has subtotals such as gross profit and operating income and provides a better view of a company’s financial state. This format is used mostly by large businesses with complex financial tasks.
Multi-step P&L statement example
Take a look at what a cake maker’s multi-step P&L statement might look like:
Sweet Treats Bakery
P&L statement
For the year ended December 31, 2023
| Category | Amount |
| Revenue | $60,000 |
| Cost of Goods Sold (COGS) | |
| – Ingredients | $12,000 |
| – Packaging | $1,200 |
| Total COGS | $13,200 |
| Gross profit | $46,800 |
| Operating expenses | |
| – Cake boxes | $1,500 |
| – Delivery costs | $2,500 |
| – Advertising | $3,000 |
| – Insurance | $1,200 |
| Total operating expenses | $8,200 |
| Operating income | $38,600 |
| Other income and expenses | |
| – Interest expense | $300 |
| Net income before taxes | $38,300 |
| Taxes | $9,575 |
| Net income | $28,725 |
Methods to prepare a P&L statement
A business may prepare P&L statements using the cash or accrual accounting method. Let’s break them down.
Cash method for P&L calculation
The cash method of accounting is a good choice for small businesses or personal finances. This approach tracks actual cash flow—money coming in and going out. When you get cash, it’s recorded as income and if you pay bills, it’s recorded as an expense. As simple as that!
Accrual method for P&L calculation
The accrual method is slightly more complicated but provides a more accurate view of the company’s financial state. Here, you recognize the revenue when it’s earned and not when the cash is received. Thus, if you deliver a product today, you recognize it as revenue today, even if you’ are paid for it in the following month.
The same goes for expenses. You record them when they’re incurred, not when you make the payment. This method assists you in seeing what is actually going on financially, even if the money hasn’t yet exchanged hands.
What is the P&L statement formula?
There’s an easy way to understand how things work in P&L:
- Sales or revenue are listed at the top of the P&L statement.
- Expenses are shown below the sales.
- The bottom line on a P&L will be the net income, also known as profit or loss.
So, the P&L statement boils down to a simple formula:
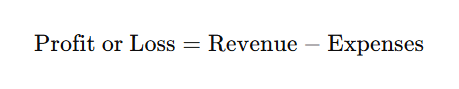
If the number is positive, it means the company made a profit. If it’s negative, the company experienced a loss.
P&L statement components
A P&L statement can be set up in different ways, but they all share the same basic parts.
1. Revenue
Revenue is the money your business earns from selling products or services. It’s the top line of the P&L report showing how much money the business brought in.
There are two types of revenue:
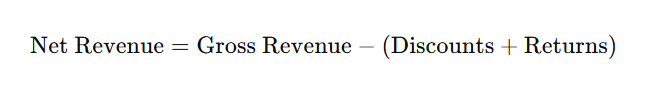
- Gross revenue (total revenue or sales): The total amount of money you make before subtracting any discounts, returns, or expenses.
- Net revenue (net sales): The money you have left after taking out discounts and returns.
2. Cost of Goods Sold (COGS)
COGS are the direct costs of producing the company’s goods or services. They include things like materials, labor, and overhead costs directly involved in production. COGS show up on the top part of the P&L before gross profit.
3. Gross profit

Gross profit is what’s left after subtracting COGS from revenue. It shows how much money the company makes from its core activities before other expenses.
4. Operating expenses
Operating expenses are the costs incurred in running the business’s day-to-day operations. They include expenses like salaries, rent, utilities, marketing, and administrative costs.
5. Operating income

Operating income is the profit from operations before deducting interest expenses and taxes. It shows how well the core business activities are generating profit.
6. Earnings before interest and taxes (EBIT)
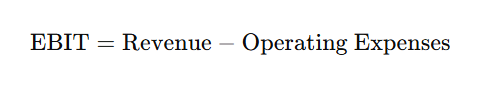
EBIT is a measure of a company’s profitability that includes all expenses except interest and income tax expenses.
7. Net income

Net income, or the bottom line, is the profit remaining after all expenses are deducted from revenue. This is the final figure showing the company’s profit or loss.
8. Earnings per share (EPS)
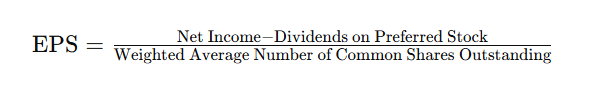
EPS indicates the portion of a company’s profit allocated to each outstanding share of common stock. It’s calculated by dividing the net income by the average number of shares outstanding.
Don’t want to calculate all those things manually?
An automated P&L statement with Synder
Synder is the tool that makes your accounting effortless and generates P&L statements for you. It gathers all your financial data from your payment processors (Stripe, PayPal, Square, etc. ) and selling channels (eBay, Etsy, Amazon, Shopify, etc.) and integrates it into your accounting software (QuickBooks Online or Desktop, Xero, or Sage Intacct).
What does it mean? Synder organizes your transactions, helps reconcile accounts, and generates clear financial reports. You can even set up custom flows to categorize transactions to match your business needs.
With Synder, creating P&L statements is simple—just pick the time frame you need, and it does the rest. Whether you need a report for this month, last year, or any other period, Synder makes it easy.
The columns in the statement may be displayed by:
- location;
- contact;
- ecommerce store;
- product;
- tags;
- tax;
- payment processor;
- month.
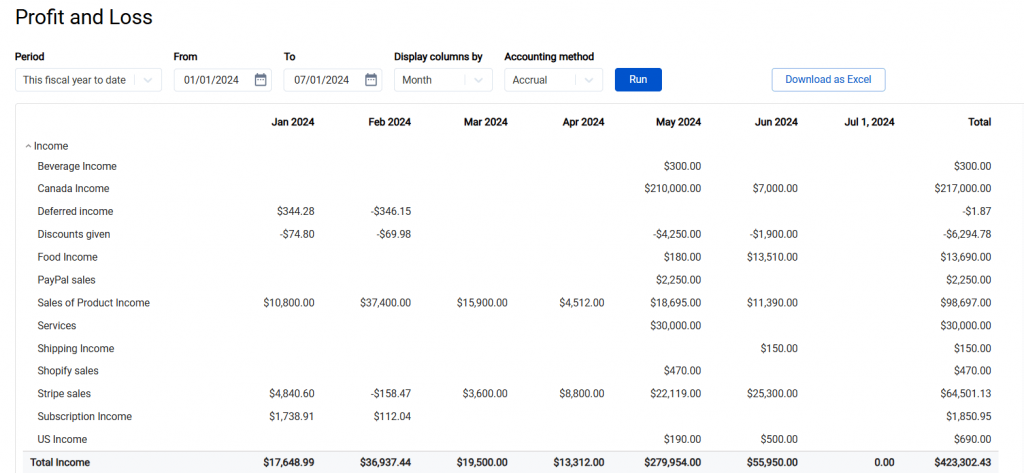
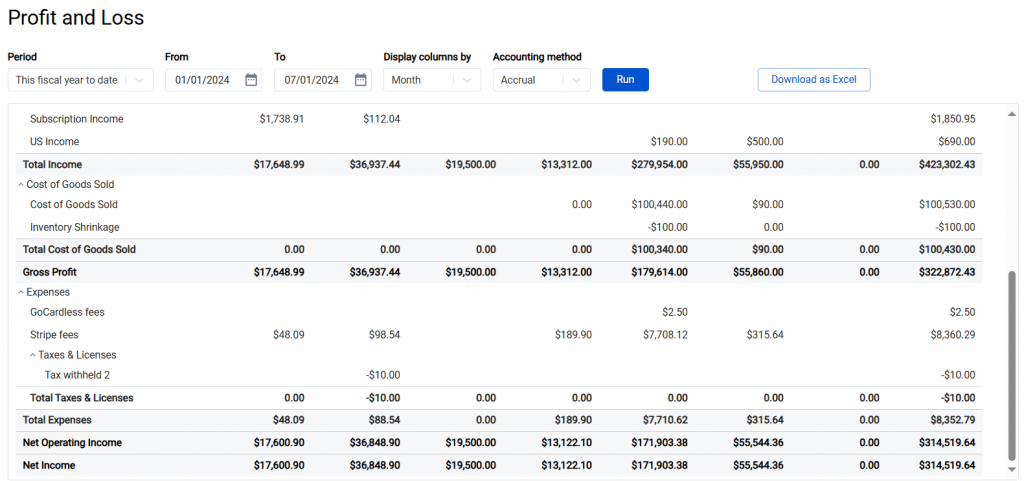
Take a look at a Synder P&L statement, where the columns are displayed by month:
How Synder creates a P&L statement
Want to know how Synder creates an accurate and detailed P&L statement? Its automation does the following:
- Once you’ve connected all your platforms to Synder, it’s constantly tracking all the money you earn from selling goods or services. It adds up your income from these activities and shows the total under ‘Total income.’
- Synder gathers all the costs related to making and selling your products, like manufacturing and shipping. It adds these up and lists them under ‘Total Cost of Goods Sold’.
- Then, Synder finds your gross profit by subtracting the COGS from your total income.
- Also, Synder looks at all the costs for running your business day-to-day—like rent, salaries, and utilities listed under ‘Total expenses’.
- Next, Synder accounts for day-to-day operating expenses like rent and salaries to determine your net operating income.
- It also includes any additional expenses or income from non-business activities. Synder adds these under ‘Total other expenses’.
- Finally, Synder puts it all together to give you a clear picture of your net income, showing if your business is profitable or not, which is displayed as ‘Net income.’
Want to know more? To see Synder in action, reserve a spot at our Weekly Public Demo, where you can learn about Synder’s general flow and bonus features, and ask questions. If you want to explore everything yourself, sign up to activate your 15-day free trial (no credit card required).
Closing thoughts on P&L
A P&L statement is one of the key financial statements that should be regularly prepared by a business. It allows you to manage the money that goes in and out of your business and gives you a clear understanding of how much you’re making or losing and why. It also allows you to look into the future with more confidence.
Required by business owners, investors, creditors, and governmental authorities, P&Ls call for special attention when prepared as the process is time-consuming and usually requires additional resources. Automation is the best way to streamline the workflow and ensure the quality of your final financial statements. So you can make your life and the life of your accountant easier by implementing Synder. This way, you’ll have total control and access to the most detailed and precise info at any time.
Share your thoughts
We want to hear from you! How do you handle your financial statements? Have you used automation tools like Synder? Share your tips and experiences in the comments below.
FAQs
What are the uses of a P&L statement?
P&L is the most scrutinized document your business has to prepare, but it’s worth the effort for a number of reasons:
- Investors look at the P&L to assess gross profit, operating profit, and net profit. These metrics help them decide if your business is a good investment.
- A solid P&L can help you secure loans, as creditors often require it to evaluate your business’s ability to repay.
- The government uses your P&L to determine your revenue taxes, making it a key document for tax filings.
- Regulatory agencies require P&L statements to ensure companies are following financial rules and paying the correct taxes.
- Analysts and financial advisors analyze P&L statements to make predictions about future performance and give advice.
Does my business need to make profit and loss statements?
If your company is publicly traded, you must prepare a P&L statement and file it along with other annual financial reports to the Securities and Exchange Commission (SEC).
While public companies are required to prepare an income statement, private companies, especially smaller ones, might not. However, even small businesses can benefit from preparing a P&L statement, as it helps track financial performance and can open doors to growth opportunities and potential financing.
How do I analyze a P&L statement?
A quick look at a P&L shows if a company is profitable or not. But digging deeper can reveal much more. When analyzing a P&L statement, horizontal analysis and vertical analysis offer different perspectives.
Horizontal analysis shows how things change over time, like comparing this year’s revenue to last year’s. It’s great for spotting trends and planning for the future.
On the other hand, vertical analysis shows how each part of the statement fits into the whole, like looking at expenses as a percentage of revenue. It assists with the comparisons and identifying areas that money is spent on.
Is P&L the same as a cash flow statement?
A P&L statement offers a broad view of your business’s financial health, summarizing revenues, expenses, and profits or losses over a given period.
A cash flow statement tracks the actual cash coming in and going out of your business, and whether your business is generating cash.
Check out our article on the differences between direct and indirect cash flows.
Is P&L the same as a balance sheet?
A P&L statement covers your business’s income, expenses, and profitability over a specific period, just like a performance report card.
A balance sheet, on the other hand, provides a picture of what the business owns,what it owes, and what shareholders’ equity is at a given date. It gives a detailed view of your financial status at a single moment in time in the future or in the past.
How often are P&L statements calculated?
Businesses typically prepare P&L statements monthly, quarterly, and annually, with quarterly and annual reports being the most common.
- Monthly P&Ls are useful in that they provide an easy way to monitor a company’s financials on a monthly basis, make decisions quickly, and control cash. It’s more about embracing the concept of early detection of trends and issues.
- Quarterly P&Ls are more useful for the investors, creditors, and regulators. They provide a broader perspective of the company’s performance and assist in the modification of strategies if necessary.
- Annual P&Ls provide a complete overview of the company’s yearly performance. These are essential for long-term planning, meeting regulatory requirements, and making major business decisions.
When applying for a business loan, companies often need several years’ worth of P&Ls. Investors and potential buyers also look at multiple years of P&Ls to gauge financial health.


This article provides an excellent breakdown of the profit and loss statement, making it much less intimidating for someone like me who isn’t a financial expert. Thanks for simplifying a complex financial concept!
Hi Dawn, thank you so much! I am very glad I could help you by clarifying the elements of the P&L statement.
Excellent article! Thanks for simplifying profit and loss statement.