
When you think about the term “executive dashboard”, the first thing that might come to mind is a digital monitoring system with lots of nice graphs and indicators to track performance data. But what makes these dashboards so special? Is there anything more than just a fancy interface with some visual information?
Let’s explore the value of executive dashboards in business, go over the information they provide, and see how they can improve your company’s business insights in general.
Keep reading to learn more about executive dashboards:
1. What is an executive dashboard?
2. Why do executives need to have specialized dashboards?
3. 8 ways in which having an executive dashboard improves reporting
4. How to create an effective executive dashboard
5. What information must an executive dashboard contain for optimal efficiency?
6. The best tools for building effective executive dashboards
7. How to select the best executive dashboard solution for your business?
What is an executive dashboard?
An executive dashboard is a visual representation of key performance indicators (KPIs) and other important business metrics that provides a quick, at-a-glance view of an organization’s performance. It’s a tool that enables executives to monitor and analyze business data in real-time, so they can quickly identify trends, patterns, and potential areas of concern.
Essentially, a reporting dashboard provides a bird’s eye view of important business data, making it easier to understand the bigger picture and make effective business decisions.
There are many advantages to using an executive dashboard, including increased transparency in reporting, improved collaboration, better business insights, and easier project management, as we’ll see later on.
Why do executives need to have specialized dashboards?
At first glance, an executive dashboard may not seem like a big deal, but they have the power to change your business in a significant way. Simply put, these dashboards enable executives to watch over their entire business from a single place and help simplify the management of essential business information.
Executives need dashboards to quickly and easily access critical information about the performance of their organization, so they can make informed decisions, take appropriate action, and plan ahead. Dashboards provide a real-time snapshot of key metrics and performance indicators, allowing executives to track progress toward goals, identify areas of concern, and prioritize resources.
In today’s fast-paced business environment, executives face increasing pressure to make quick, data-driven decisions. Dashboards provide a centralized location for key performance data, eliminating the need for executives to manually gather and analyze information from various sources. By streamlining the decision-making process and improving visibility into organizational performance, dashboards can help executives stay ahead of the competition and drive business success.
Additionally, dashboards allow executives to easily share information with other stakeholders, such as investors, board members, or employees. By presenting a clear and concise view of the organization’s performance in a visual format, dashboards help align everyone around common goals and foster a culture of accountability and transparency.
Read more about the importance of data-driven analytics for companies or get more information on how businesses can utilize business intelligence.
8 ways in which having an executive dashboard improves reporting
Let’s look at different ways in which executive dashboards can improve the business insights and reporting for your company.
1. They provide transparency in reporting. If you work in a big company, you know how important it is to have transparency in your reporting. With an executive dashboard, you can provide your managers and board members with a clear view of how the business is doing.
2. They encourage collaboration. An executive dashboard is a perfect tool to encourage collaboration between the different departments in your company, from the marketing to sales team and everything in between. By seeing how each department and team is progressing (or not), you can collaborate and find a solution that works for everyone.
3. They give you a big picture of your business. When you have a clear picture of how your company is doing, it’s easier for you to adapt to any changes that are taking place within the business. You can make smart decisions and find solutions to any problems or challenges that your company is facing.
4. They help you make better decisions. With executive dashboards, you are better able to understand your customer base and key performance indicators that are important to your business. This means that you have the data you need to make informed decisions and make the right calls for your company.
5. They help your company stay ahead of the competition. With a dashboard, you can easily see what strategies and marketing campaigns your competitors are using and adapt them for your business.
6. They improve data accuracy. With an executive dashboard, data is sourced from a centralized location, ensuring data accuracy and consistency. This reduces the risk of errors due to manual data entry or inconsistencies in data sources.
7. They enable customizable reporting. An executive dashboard can be customized to meet the unique needs of a business, allowing executives to focus on the metrics and KPIs that matter most to them. This can provide a more tailored and relevant view of business performance, rather than a generic report that may not be as useful.
8. They promote accountability. With an executive dashboard, everyone in the organization can see how the company is performing against key metrics and goals. This promotes a culture of accountability and transparency, as employees are held responsible for meeting their targets and objectives, and are able to see how their performance contributes to the overall success of the business.
How to create an effective executive dashboard
Here are some tips and steps you can follow to create effective executive dashboards:
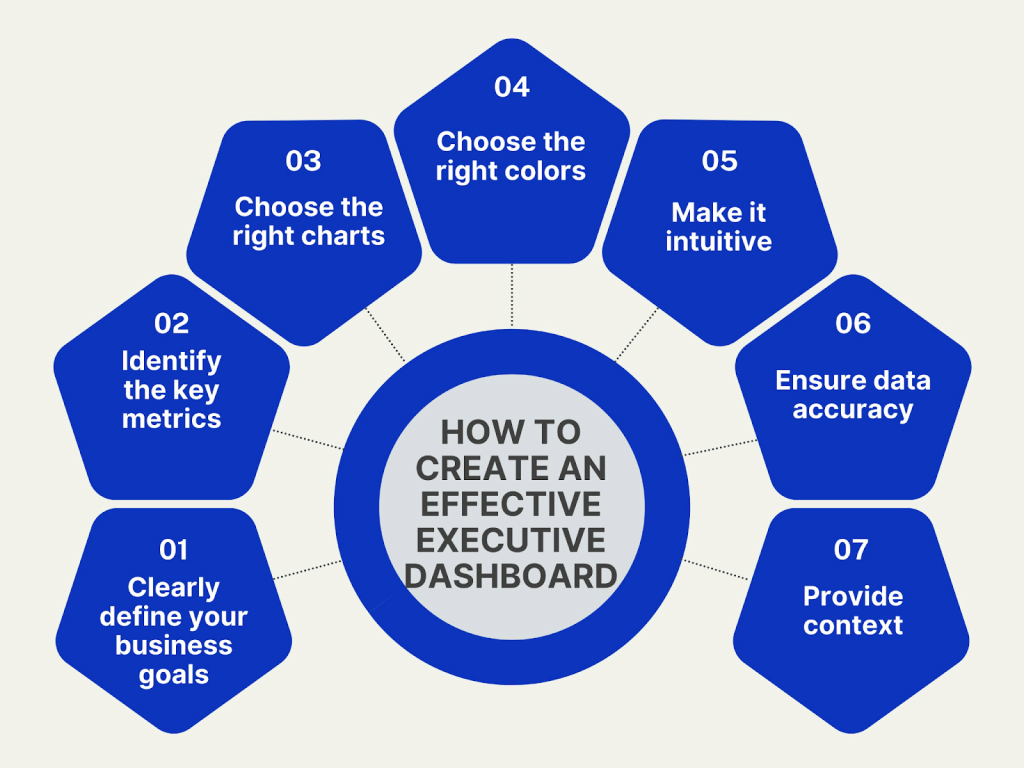
- Clearly define your business goals. The first thing you need to do is to clearly define your business goals. This will help you determine what data you need to track and what metrics you should include in your dashboard.
- Identify the key metrics. Once you’ve identified the key metrics, you need to decide what data you want to track. Make sure you choose the most important metrics, such as revenue, customer retention rates, marketing campaigns ROI and performance, and other business KPIs.
- Choose the right charts. Once you’ve decided on the right metrics, you need to decide which charts will be most effective in your dashboard. The most commonly used charts in executive dashboards include bars, lines, and tables.
- Choose the right colors. Color psychology plays an important role in the way your executive dashboard is perceived. Make sure you choose colors that don’t distract your audience, but instead, guide them toward the data they need to see.
- Make it intuitive. Your executive dashboard should be easy to use and navigate. Make sure that the information is organized in a logical and intuitive way, and that the essential data can be easily accessed and interpreted.
- Ensure data accuracy. The data displayed on your executive dashboard should be accurate and up-to-date. Make sure that the data is being pulled from reliable sources and that there are no errors or discrepancies.
- Provide context. Make sure that the data on your executive dashboard is presented in context. This means providing additional information or explanations that help everyone included understand what the data means and why it’s important.
Read more about data dashboards and best ways to create them.
What information must an executive dashboard contain for optimal efficiency?
A good executive dashboard is a critical tool for providing high-level, at-a-glance insights into the performance of an organization or company. It enables executives to track key metrics, identify trends, and make data-driven decisions quickly and efficiently. To be effective, a good executive dashboard needs to contain the following information:
- Key performance indicators (KPIs): The most important metrics that drive business performance should be prominently displayed on the dashboard. These KPIs could be financial metrics like revenue, profit, marketing campaigns ROI, and cash flow, or operational metrics like customer satisfaction, employee engagement, and product quality. These metrics should be updated in real-time or at least daily, so that executives can make informed decisions based on the latest data.
- Historical trends: In addition to current performance metrics, it’s essential to include historical data and trends on the dashboard. This information helps executives understand the dynamics of performance changes over time and identify areas of improvement or concern. Historical data can also be used to forecast future performance and set targets for the organization.
- Data visualization: The best executive dashboards use data visualization techniques like charts, graphs, and tables to present complex data in an easy-to-understand format. Visualizations can quickly highlight trends, patterns, and outliers, allowing executives to identify areas that require further investigation or action.
- Drill-down capabilities: While high-level metrics are important, executives also need the ability to drill down into the underlying data to understand the root causes of performance issues or opportunities. A good executive dashboard should allow users to explore data at a granular level and filter information by different dimensions like geography, product line, or customer segment.
- Actionable insights: Finally, a good executive dashboard should not just present data, but also provide data-driven insights and recommendations for action. For example, if revenue is declining in a particular region, the dashboard should highlight potential causes and suggest specific actions that can be taken to address the issue.
The best tools for building effective executive dashboards
You can create effective executive dashboards manually from scratch, however, there are many reporting tools available in the market that can streamline this process for you.
The best reporting tool for your organization will depend on your specific needs, budget, technical expertise, and the primary goal you want to achieve with your reporting dashboards.
Here are some of the most popular reporting tools used to build executive dashboards, one of which might prove to be the best fit for your business needs:
1. Synder Insights: Synder Insights is a reporting and analytics solution every serious ecommerce business needs to drive their sales and skyrocket their revenue, as it collects real-time data and presents it in a comprehensive and actionable way. The tool gathers your sales, customer and product data from all connected ecommerce platforms and payment gateways and presents it on a single dashboard in helpful KPI reports. Synder is enjoyed by many for data-driven analytics, 25+ integrations that come at no additional costs, easy setup, top-rated customer support and security.
2. Google Sheets: Google Sheets is a great reporting tool when you can build a reporting dashboard. You can create a spreadsheet, add charts, graphs, and all the necessary information, and you’re ready to go. It’s a very flexible tool, allowing you to introduce changes when you need to.
3. Microsoft Power BI: Power BI is a cloud-based business intelligence platform that provides a suite of tools for data analysis and visualization. It’s known for its user-friendly interface, powerful data modeling capabilities, and integration with other Microsoft products.
4. Tableau: Tableau is a leading data visualization and analytics tool that allows users to create interactive dashboards, reports, and charts. It’s known for its powerful data blending and real-time analytics capabilities.
5. QlikView/Qlik Sense: QlikView and Qlik Sense are powerful information discovery and visualization tools that allow users to create interactive dashboards, reports, and charts. They are known for their intuitive user interface and powerful data modeling capabilities.
6. SAP BusinessObjects: SAP BusinessObjects is a suite of business intelligence tools that provide a wide range of reporting, dashboarding, and data visualization capabilities. It’s known for its scalability, security, and integration with other SAP products.
7. IBM Cognos: IBM Cognos is a comprehensive business intelligence platform that provides a suite of tools for reporting, analytics, and dashboarding. It’s known for its powerful data modeling and integration capabilities, as well as its support for predictive analytics and machine learning.
8. Asana: Asana is a project management software that offers various features to help teams manage their work more efficiently. One of the features of Asana is a dashboard that provides a high-level overview of project progress, including metrics such as task completion rates, team workload, and project milestones. While Asana’s dashboard is not specifically designed as an executive dashboard, it can serve as a useful tool for executives who want to stay informed about project progress and identify potential areas for improvement.
In addition, many of these reporting tools offer free versions with limited features or restrictions, which can be a good option for smaller organizations or individual users. It’s always a good idea to try out a free trial or free version before investing in a paid subscription to ensure that the reporting tool meets your needs and is a good fit for your organization.
How to select the best executive dashboard solution for your business?
Selecting the best executive dashboard for your business can be a daunting task, given the numerous options available in the market. However, by following a few key steps, you can find an executive dashboard that meets the unique needs of your business.
1. Determine your business needs: Start by identifying the specific needs of your business, such as the metrics you want to track, the level of data granularity required, and the type of data visualization that suits your business. Having a clear understanding of your business needs is crucial to selecting an executive dashboard that can provide the right insights for your business.
2. Identify the right features: Once you have identified your business needs, the next step is to identify the features you need in an executive dashboard. Some of the common features to look out for include data integration capabilities, data visualization options, data security, and accessibility across devices.
3. Evaluate different options: With your business needs and desired features in mind, evaluate the different executive dashboard options available in the market. Look for solutions that offer a free trial or demo to test their functionality and determine if they meet your business needs.
4. Consider the user experience: An executive dashboard should be easy to use and navigate, even for non-technical users. Consider the user experience of the dashboard, such as the ease of accessing information, customizability, and ease of creating reports.
5. Analyze the cost: Finally, analyze the cost of the executive dashboard solution, including any additional charges for features, maintenance, and support. It’s important to ensure that the cost of the solution aligns with the value it provides to your business.
Conclusion
Executive dashboards are a powerful tool for providing business insights that can help executives with their overall business management by enabling them to make informed decisions and take action accordingly. These dashboards offer a bird’s eye view of important business metrics and information, making it easier to understand the bigger picture. Moreover, they provide transparency in reporting, encourage collaboration, and help executives stay ahead of their competitors.
In addition, creating an effective executive dashboard requires identifying key metrics, selecting the right charts and colors, and providing actionable insights and information, so make sure you have everything covered to get optimal results.
Finally, there are many reporting tools available in the market that can help streamline the process of building an executive dashboard. While the best reporting tool for your organization will depend on your specific needs, budget, and technical expertise, these tools offer a range of features and functionality to create interactive dashboards, reports, and charts.
Synder Insights is one such tool that can help you track all the vital KPIs and increase the accuracy of your reporting. Sign up for a free trial or join a Weekly Public Demo and find out how Synder Insights can help you grow your business today.