E-commerce businesses generate a significant amount of data that can be harnessed to make informed decisions and drive growth. However, the sheer volume of data can be overwhelming, and without properly analyzing it, businesses may miss out on valuable insights. Accountants and financial advisors can play a crucial role in guiding businesses through the data analysis process and helping them make sense of the numbers.
In this article, we’ll explore the process of successful data analysis and analytics in e-commerce businesses and the benefits of using accounting software to streamline it.
Contents:
1. What is the data analysis process?
- Where do data analysis and analytics intersect?
- How can data analysis skills benefit an accounting career?
2. Data analysis steps: four basic steps you need to know
3. The importance of data analytics in e-commerce business management
4. Challenges accountants face handling e-commerce data
5. How to analyze data for actionable insights using your workforce and resources efficiently
What is the data analysis process?
In a nutshell, the process of data analysis involves examining and interpreting data to extract valuable insights. It includes collecting, cleaning, modeling, and visualizing data to identify patterns, trends, and relationships. Data analysis is vital for e-commerce businesses as it helps them make data-driven decisions, optimize operations, and improve customer experiences.
Data analysis is a critical component of data analytics, as it helps prepare the information for the analytical process. Without it, data analytics may be ineffective. It highlights the importance of understanding both processes for successful e-commerce business management.
Where do data analysis and analytics intersect?
Data analysis and data analytics intersect in several ways. Both processes imply examining and interpreting data to gain actionable insights, and they rely on many of the same statistical and computational techniques. For instance, both involve identifying trends and patterns, which can help businesses make decisions based on their numbers rather than assumptions. Additionally, both processes require tools and software to handle large volumes of information efficiently. Among these are data transformation tools, which are crucial in restructuring and reformatting data to make it more usable and accessible
Data analysis focuses on cleaning, transforming, and modeling data to ensure it’s clean, relevant, and accurate. Data analytics uses advanced statistical and computational methods to extract insights and create predictive models. So, as previously mentioned, data analysis lays the foundation for data analytics. By working together, these two processes provide a comprehensive approach to managing data in e-commerce businesses and foster more informed decision-making based on data-driven insights.
How can data analysis skills benefit an accounting career?
Today, accounting is no longer just about bookkeeping and financial reporting – it now involves data analysis and data-driven decision-making. As businesses generate more and more data, the ability to make sense of it becomes a valuable skill for accountants. Accountants can leverage the knowledge of data analysis to add value to their clients by providing insights into their financial performance, identifying trends, and making recommendations for improvement.
Accountants who possess data analysis skills are also in high demand in the job market, as companies seek professionals who can not only manage financial information but also analyze it to drive strategic decisions. By staying up-to-date on the latest data analysis tools and techniques, accountants can enhance their career prospects, increase their earning potential, and stay competitive in the industry.
Data analysis steps: four basic steps you need to know
As mentioned above, the data analysis steps include collecting, cleaning, modeling, and visualizing data. Let’s break them down and see how they apply to e-commerce businesses.
Step #1: Data collection
The first step in data analysis is collecting data. Usually, e-commerce businesses gather various data from multiple sources, including sales data, customer data, website analytics, social media metrics, and more. The sources might include e-commerce platforms that serve as online storefronts, payment processors, online marketplaces, etc. The key to successful data collection is to ensure that the data is accurate, relevant, and complete. Incomplete or inaccurate data can lead to faulty analysis and incorrect conclusions.
Step #2: Data cleaning
Data cleaning, or cleansing, aims at identifying and correcting errors, inconsistencies, and inaccuracies in data that might occur due to human error, system errors, or data integration issues. Data cleaning might involve removing duplicate entries, filling out missing data, standardizing data formatting, and verifying data accuracy. Without data cleaning, analysis results can be inaccurate, leading to poor decisions and lost opportunities for businesses.
Step #3: Data modeling
Data modeling involves statistical analysis and mathematical techniques to identify patterns and trends. It helps e-commerce businesses understand customer behavior, optimize pricing strategies, and identify new market opportunities. Data modeling is an iterative process that involves testing different hypotheses and refining models until getting the best fit.
Step #4: Data Visualization
Data visualization is an essential part of data analysis, as it allows businesses to communicate complex insights and trends to stakeholders in an easily digestible format. The human brain processes visual information more quickly and efficiently than text, making data visualization an effective way to convey information. Data visualization can take many forms, including charts, graphs, dashboards, and heat maps. Each has its strengths and weaknesses, and the choice of visualization type will depend on the type of analyzed data and the purpose of the analysis.
The importance of data analytics in e-commerce business management
We already mentioned that data analysis creates the foundation for effective data analytics. In the e-commerce industry, data analytics plays a critical role in business management. With the vast amounts of data generated by e-commerce businesses, it’s crucial to make sense of it and extract actionable insights to inform decision-making and improve performance.
By exploring data, businesses can get a better grip on customer behavior, sales trends, and inventory management. For example, data analytics can help identify their most profitable products and customer segments, allowing them to target marketing efforts more effectively.
Moreover, data analytics can help e-commerce businesses optimize their pricing strategies and determine the optimal price points for their products and services, ensuring they’re competitive in the marketplace while maximizing profits.
Additionally, data analytics can help businesses optimize their inventory management processes, reducing waste and improving efficiency.
Ultimately, data analytics provides businesses with a powerful toolset for tracking performance, identifying areas for improvement, and staying ahead of the competition. By leveraging data analytics to track KPIs and other metrics, businesses can make informed decisions and take actions that drive growth and success.
Challenges accountants face handling e-commerce data
E-commerce data analytics can be challenging for accountants due to several factors: from the amount of data to handle to the lack of expertise or experience in data analytics for e-commerce. We’ll look at some of the most common challenges in more detail.
Data volumes
E-commerce businesses generate vast amounts of data, which can be overwhelming to manage. Without the proper tools and techniques, it can be challenging to identify patterns and extract insights from this data.
Having to process unstructured data
E-commerce data is often unstructured, meaning that it may not fit neatly into traditional accounting frameworks. Accountants may need to develop new methods for analyzing this data, which requires specialized knowledge and expertise.
Fast-paced environment
E-commerce businesses often operate in a fast-paced, constantly changing environment. This means that data is generated at a high velocity, making it challenging to keep up with the latest trends and insights. Additionally, e-commerce businesses may need to adapt quickly to changing market conditions, which requires real-time data analysis and decision-making.
Lack of skills in analyzing and interpreting e-commerce data
Finally, e-commerce data analytics requires a unique skill set that combines accounting and financial expertise with knowledge of statistical and computational methods. This can be challenging for accountants who may not have the necessary training or experience in these areas.
As you can see, analyzing and interpreting e-commerce data requires quite an effort due to the sheer volume and complexity of data to deal with and the need to take into account multiple variables. At this point, manual data analysis isn’t an option, as it might require time and resources a business might not have. So various analytics software comes in handy to help accountants perform the analysis more efficiently and be able to provide valuable insights with no delay.
How to analyze data for actionable insights using your workforce and resources efficiently
Accounting software can streamline the data analysis process for e-commerce businesses. It can automate data collection, cleaning, and modeling tasks, saving businesses time and resources and helping power internal or part-time financial advisors’ efficiency in providing a business with the expected value. This way, businesses can have real-time insights, allowing them to make timely decisions based on accurate data.
We’ll look at how it works on the example of Synder.
Synder is an e-commerce accounting and analytics software that can help financial advisors make the most of e-commerce business data. It integrates data from 25+ e-commerce platforms and payment processors, like Shopify, WooCommerce, Amazon, Stripe, Paypal, and more (including Excel data), to automate collection and cleaning tasks and help businesses make sense of their numbers. At this point, Synder helps businesses create custom reports and dashboards, providing real-time data insights that are easy to understand and act upon.
Let’s break it down.
Collecting and cleaning data from multiple sources
As mentioned above, Synder can easily connect all business’s sales platforms and payment processors to integrate data into a single environment ready to work with. Your only effort at this step would be, upon signing up, to select the necessary platforms from the list and grant Synder permissions to extract data from them (it’s a pretty straightforward and intuitive process, easy to perform).
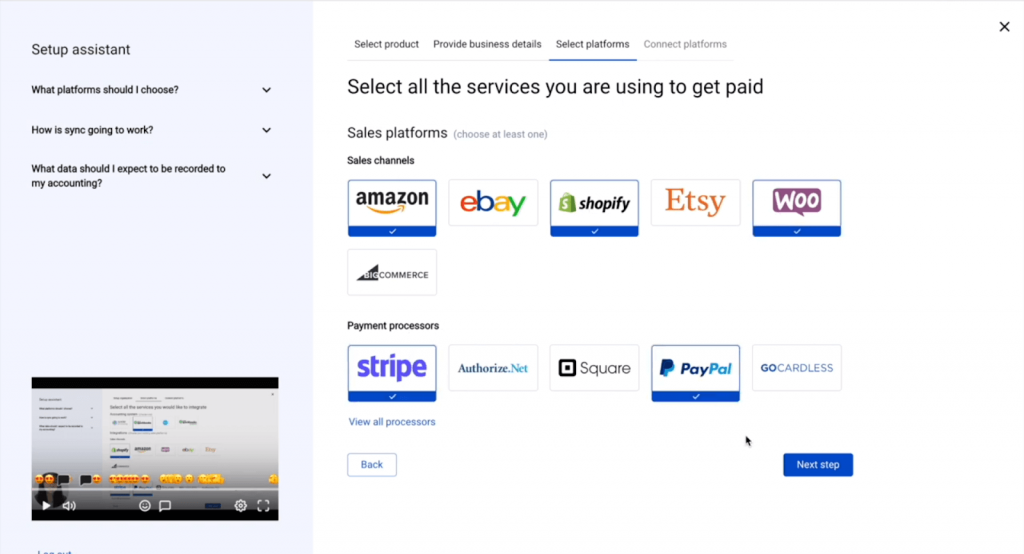
After the initial setup, Synder will import 2 months worth of data from your sales channels (but you can go further and import as much historical data as you need, there’s no limit). The data will come clean from duplicates and at a high level of detail and data integrity: you’ll have your customer and product names, sales amounts, processor fees, taxes, and more.
Data modeling and visualization
The integrated data comes arranged into a handy visual dashboard, providing a 360-degree view of a business, including sales, customer, and product analytics.
Each dashboard section provides a bunch of reports on the most important e-commerce metrics enabling accounting specialists to track and analyze sales, customer behavior and product performance all in one place.
The biggest convenience of the dashboard is having the possibility to switch between various reports, easily comparing different metrics, which facilitates identifying trends and patterns in data, making data analysis more efficient.
Data interpretation and analysis
From the dashboard, you can open any report individually to dissect the data it contains and get the insights into the performance of this very aspect of your business. You can filter the data by various dimensions, such as the region your sales come from, and break it down by sales channels, products, customers, etc. It allows you to compare your performance across sales channels to see opportunities or the need for improvement, better understand your product dynamics and customer behavior to find out certain trends and dependencies and come up with the actionable next moves.
Let’s take a quick look at what the reports might look like for you.
Cashflow
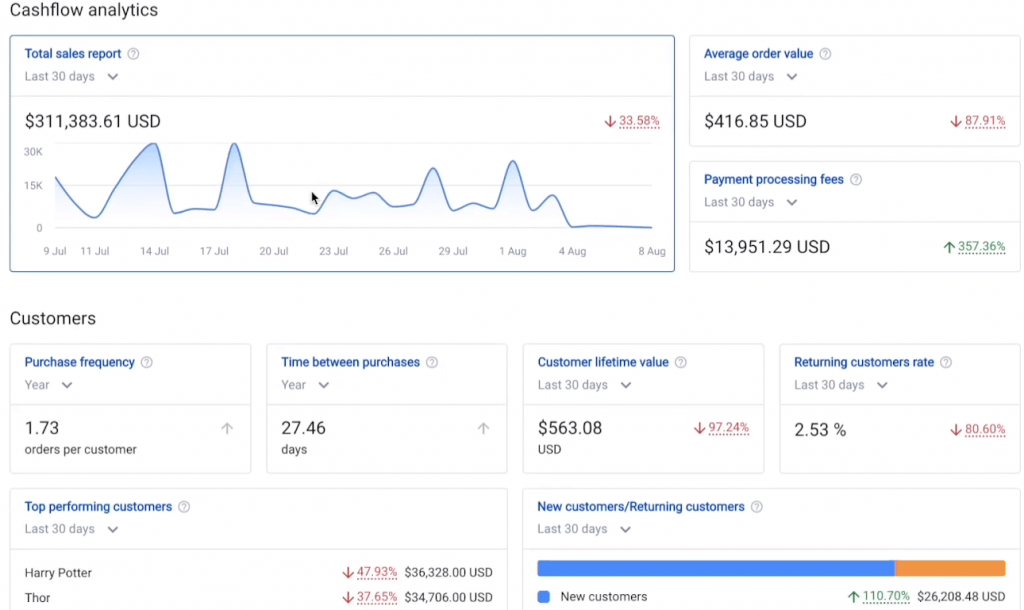
At the Cashflow analytics section, you have reports on various aspects of your sales, including Total sales, Average order value, and Payment processing fees.
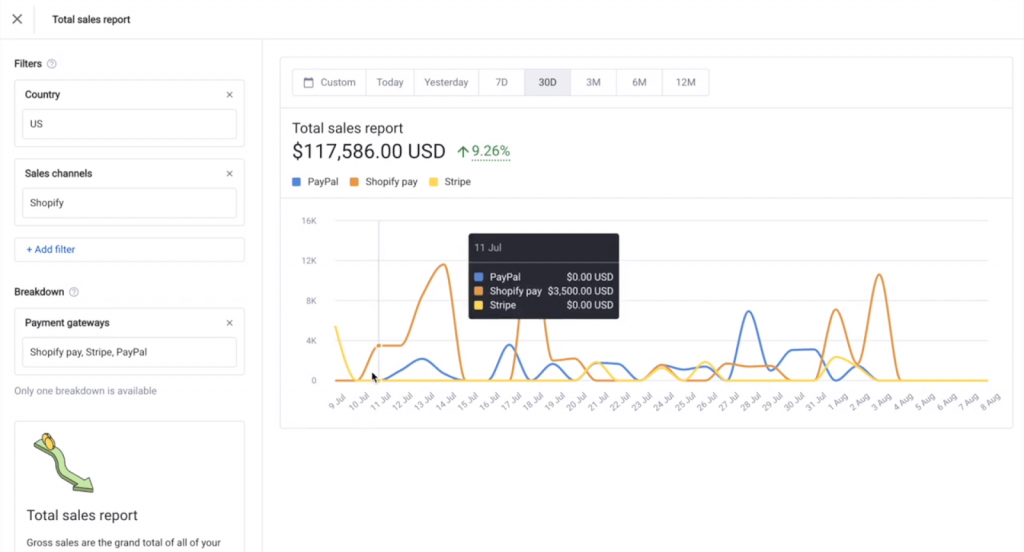
As previously said, you can apply various filters and break the data down based on different dimensions, depending on what questions you need to answer. You can easily compare the performance for different time ranges (to identify ups and downs in sales, for example and find correlations with seasonality, your marketing efforts, ad campaigns, etc.). You can also understand which of your sales platforms bring you the most revenue, where your biggest order values come from, or how much of your revenue is eaten up by the processing fees, and much more.
Customers
The Customer analytics section allows you to dive deeper into various aspect of your customers’ interaction with your business, pinpoint certain behavioral patterns and identify trends that you might later use to tweak your strategies, like marketing or outreach, and come up with more targeted and actionable offers and campaigns to acquire more customers or win back your existing ones to encourage them to buy more from you.
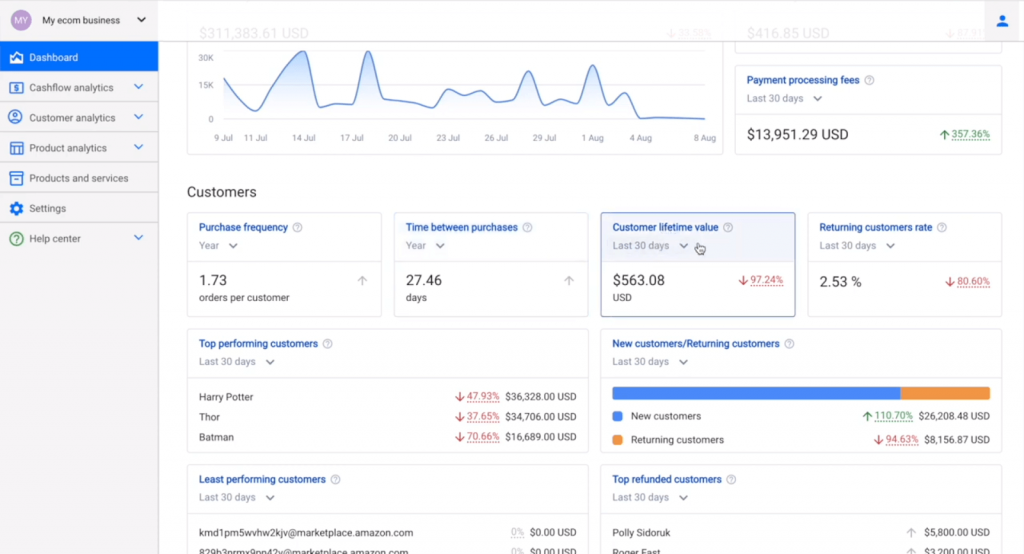
Here, you have access to the most crucial customer metrics such as CLTV, purchase frequency, time between purchases, returning customers rate, best and least performing customers, and more.
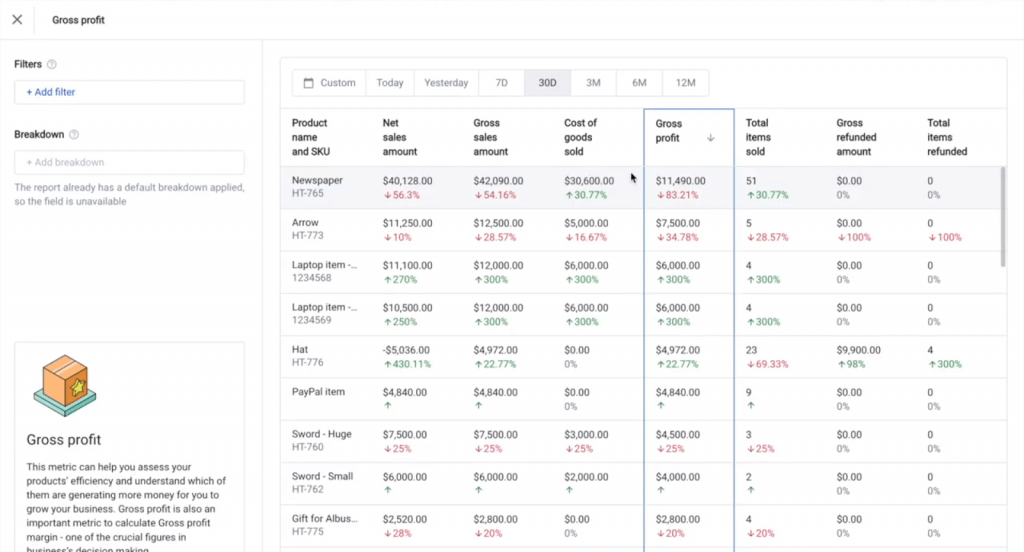
Products
The product analytics section provides an overview of all products, giving you access to instant insights of how your products sell and your inventory moves through your business. At this point, you have all the necessary instruments to better understand your demand, identify items that sit too long on the shelf, risking going obsolete, and overall, manage your inventory and supply better. From the gross profit to best-selling products to those most purchased together – you have all the necessary reports to help optimize your performance.
Long story short, as an advisor, it would be great if you could focus on the analysis and interpretation of business data and leave aside all the technical aspects of collecting and organizing data to make it digestible. At this point, the software is your best ally, enabling you to provide more value to your customers through data-driven insights and recommendations, helping to ensure their books are in order and taxes are taken care of. Ьoreover, they have a deeper understanding of their business and how to grow it based on accurate and actual data.
Feel free to book office hours to learn more details about Synder Insights and how it can help пкщц your clients’ business and contribute to your practice as an accountant. You can also sign up for a free trial to get an idea of how Synder works. You might also want to explore our Educators Program. In any case, if you feel like you might need more assistance, please don’t hesitate to contact our team to get your questions answered.
Bottom line
As you can see, data analysis and data analytics – as the practice of working with data to glean useful information – are essential tools for e-commerce businesses. Accountants and financial advisors play a crucial role in guiding businesses through data analysis, helping them gain valuable insights into their operations, customers, and market trends and allowing them to make informed decisions that drive growth and profitability. However, with the vast amounts of data generated by e-commerce businesses, manual data analysis is time-consuming, error-prone, and often impossible. That’s where accounting automation software comes in, helping accountants and financial advisors streamline data analysis and gain insights into their clients’ e-commerce businesses. By leveraging data analytics tools and skills, accounting specialists can add value to their clients’ business practices, stay competitive in the industry, and drive their own career success.