Businesses generate volumes of data, and analyzing this data is integral for making informed decisions. A powerful tool for understanding business data is a data dashboard. However, many dashboards fail to serve their purpose due to unclear structure, unthoughtful design, and poorly organized information. At this point, to create an effective dashboard, one should understand the principles of data visualization.
In this article, we’ll explore what it takes to create a dashboard that works and look at some examples of an impactful data dashboard for your business, regardless of its size or scope.
Read on to discover how a proper dashboard can power your business:
1. Learn the basics: What is a data dashboard?
2. Typical components of a data dashboard
3. Understanding how data dashboards work
4. How to find out which type of dashboard will meet your needs?
5. Bonus: Tips on creating your business data dashboard
6. What industries or businesses might benefit from using dashboards more than others?
Learn the basics: What is a data dashboard?
In the Business Intelligence (BI) context, a data or analytics dashboard is a visual presentation of data that helps users monitor performance and track a company’s metrics. It’s an interactive display of information, usually organized in tabular format. Well-designed data dashboards provide a compilation of many screens of statistics, giving readers the status of key performance indicators (business KPIs) at a glance.
It’s a carefully designed compilation of information connected to your files/services/APIs and presented in a way that allows viewers to grasp key points quickly. It should also be interactive so that users can drill down for more new details when desired.
Whether you work in marketing, sales, or operations or even run your own ecommerce business, it can shed light on the strengths and weaknesses of your organization.
In other words, it’s an interactive analysis tool used by businesses to track and monitor the performance of their strategies with quality and precision. It helps gather, organize, and visualize their data in a user-friendly and intuitive way to gain valuable insights and make decisions based on accurate numbers rather than assumptions.
A data dashboard example

Typical components of a data dashboard
Dashboards management can be as simple as a spreadsheet with KPIs or as complex as an interactive data visualization tool.
The given information allows you to monitor important performance indicators (KPIs) at a glance so that you can react faster when something new or out of the ordinary occurs. These visual representations of data usually consist of multiple pre-built widgets which are connected together by aligning them on the same dashboard. So what are these widgets? Let’s look through the main ones.
📊 Charts and graphs
They summarize information quickly and clearly so viewers can see patterns and trends. A graph is a visual display of data such as numbers or quantities; a chart is usually a graph that uses colors or symbols to show the same information in a different way.
📈 Business KPIs and metrics
They can help a company understand how well it’s doing in meeting its goals by quantifying performance in specific areas, such as increasing sales or decreasing turnover time.
📑 Reports summaries
Since custom data dashboards are interactive, it’s important to have the original source from which the information was taken at hand. By clicking on a particular graph or metric, the viewers can see a detailed report if they have concerns about the given information.
🔻 Alerts and notifications
Small icons displayed on the dashboard near the numbers can be really informative and useful, especially when showing a negative index. For example, they can alert you that the strategy you’ve been using isn’t as efficient as you thought it would be. This way you can take action on time and save time, money, or energy for more profitable operations.
Can it replace reports?
Not exactly.
Data dashboards and reports are two sides of the same coin. Both of the methods show you the performance of business strategies, but the reports are about periodic observations when the data dashboards are about continuous monitoring.
Plus data dashboards are easier to understand since the primary component there is visualization. Reports give you clear information with numbers that need to be checked and analyzed, while data dashboards provide you with the most important information at a glance.
Understanding how data dashboards work
Data dashboards can be set up as part of a centralized monitoring system or as a stand-alone solution for individual departments. You can choose the one that best meets the needs of your users, department or organization, by integrating the dashboard with your company dataset, ensuring all key metrics and performance indicators remain consistent across teams.
The two most-known opportunities for dashboard management are Excel Dashboard or Google Data Studio. But let’s look through the general flow of setting up your personal dashboard regardless of the solution.
✔️ Think about the goals you want to achieve
The format of your dashboards will depend on what you want to monitor. Once you understand which KPIs and metrics are necessary for your goal, you can start organizing your data dashboard.
How to understand which KPIs and metrics to track
First of all, you need to accept the fact that it’s pointless and inefficient to monitor everything in the same place. You have to prioritize the spheres and keep track of the numbers that are really important. Having lots of numbers side by side may be hard to read and make a lot of mess.
Here are some suggestions on what to track based on your preferred sphere.
Marketing:
- Customer engagement
- Customer churn rate
- Cost of customer acquisition
- MQL to SQL conversion rate
Sales:
- Customer Lifetime Value (CLV)
- Monthly sales growth
- Average order value (AOV)
- Payment processing fees
Additional metrics to track:
- Customer return rate
- Inventory turnover rate
- Purchase frequency
- Time between purchases
✔️ Pick a tool and/or a template
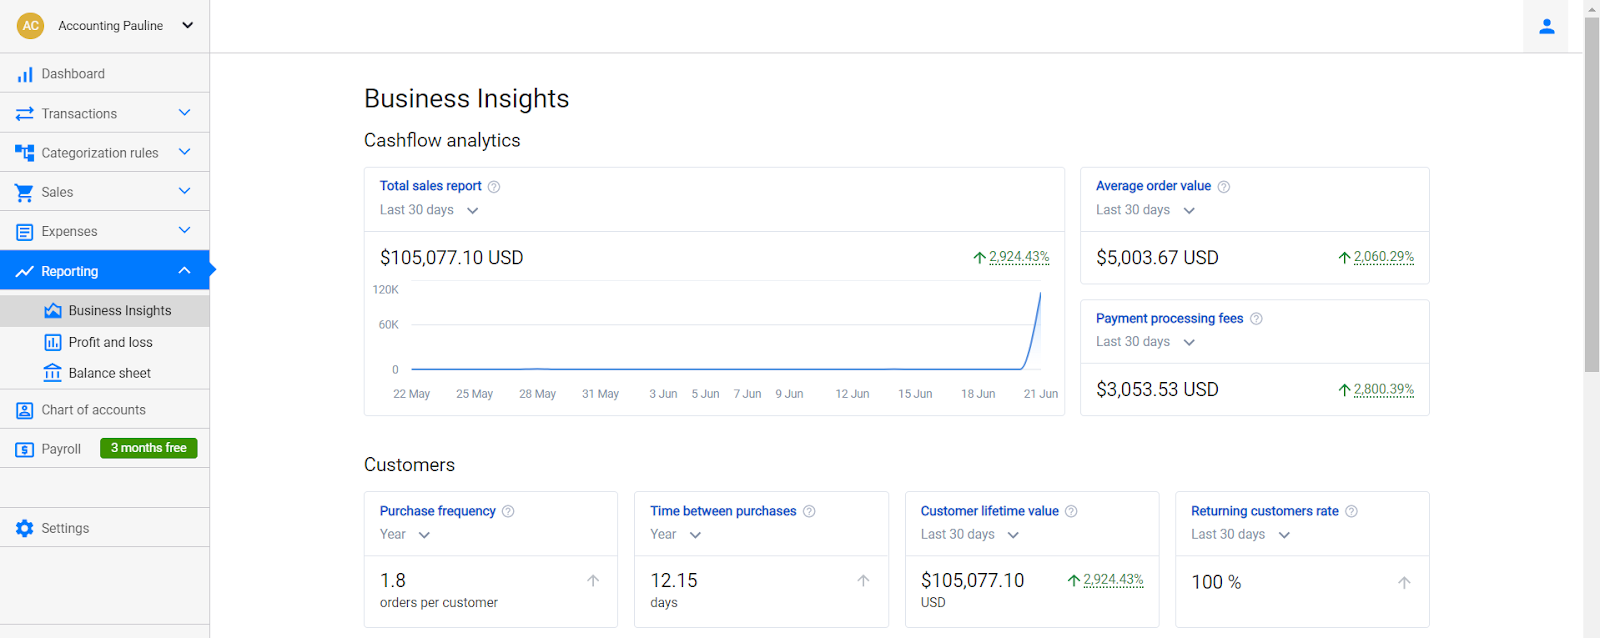
Effective dashboard management isn’t exactly rocket science, but it does require some thought and planning. A well-designed dashboard will help you keep track of performance metrics over time so you can see how effective certain strategies are and make changes if needed. That’s why it’s important to choose the right data dashboard software for your business dashboard creation/management or find the right template. The easiest example of how to manage your data in a minimalistic and efficient way is Synder’s Business Insights dashboard:
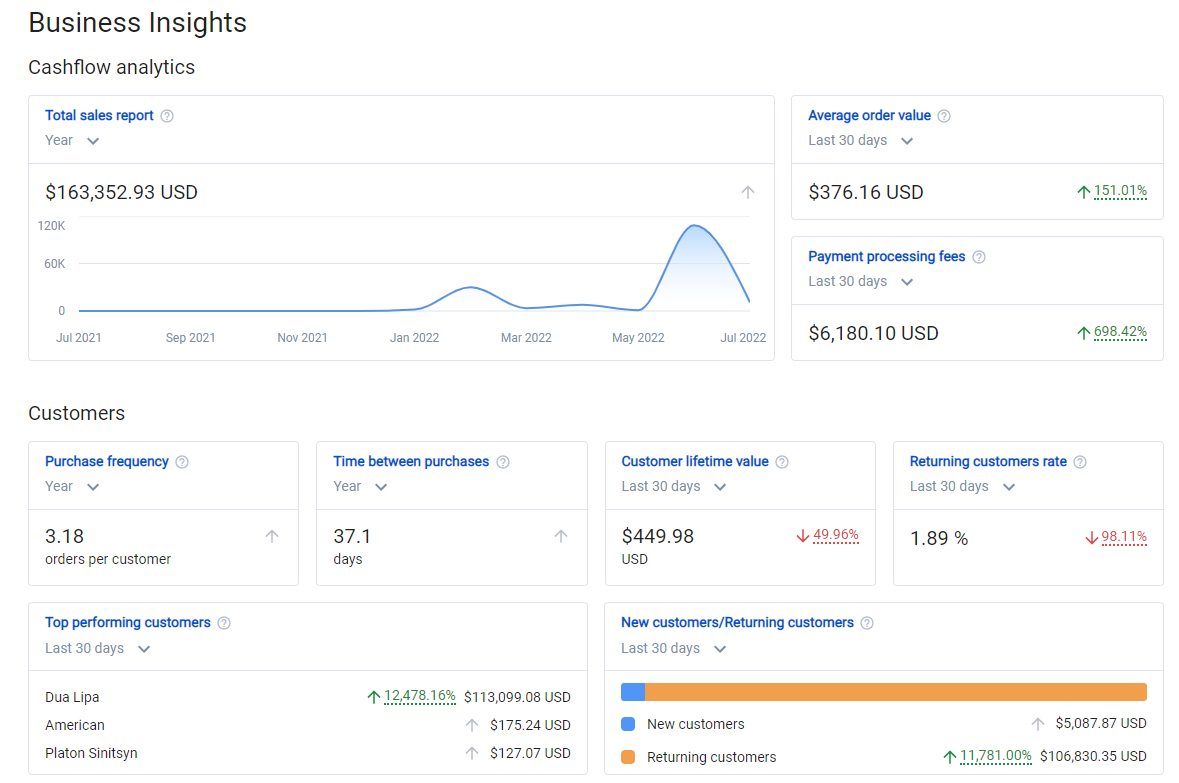

The software divides the given information from the connected platforms into categories such as customers and products and helps you monitor the most essential KPIs and metrics for your business. The calculations are automated so you don’t need to worry about spending time on inserting information about your business.
This feature creates a perfect workflow between accounting work and analysis, especially since you or your accountant can do both in the same place.
Choose the date that works for you and/or your accountant and book a seat at our webinar with our incredible specialists to learn more how Business Insights dashboard management works or try the workflow yourself.
✔️ Visualize the hierarchy
Data visualizations are more than just pretty pictures to catch the user’s eye. It’s a graphical representation of data, which aims to help users interpret the information more easily, rather than looking at raw numbers and spreadsheets. In other words, effective dashboard management helps you take actionable insights from your data faster.
Visualizing your data and having all of it in one place will not only make it easier for you as a user to navigate through your dataset, but also reduce the time it takes you to analyze the new data. This means that when it comes to building dashboards for your business intelligence software, visualizing your hierarchical data is one of the most important things that you need to do.
✔️ Connect your data sources
Let us venture a guess. You’ve got a lot of data. You have so much information stored, analyzed, and archived that it would probably take several lifetimes to read through it all. That’s only half of the problem. You’ve got various types of data — structured and unstructured, static and dynamic, big data and small data, internal company data and external market research data, etc.
With all this information at your disposal, the challenge is finding ways to manage all that information so you can use it actively without getting buried under an avalanche of information or needing an entire data management team. In other words, you’d like to connect the dots between all the various forms of your massive amounts of data so that you can find what you need when you need it and without spending hours doing so.
That’s why the implementation of a data dashboard involves connecting your data sources to your dashboard.
How to find out which type of dashboard will meet your needs?
A data dashboard can be as simple as a spreadsheet with hyperlinked check boxes that users click to filter out information they don’t need to see at that moment. Or it might be more complex, such as a graphic user interface with several interactive charts and graphs that users can adjust at will.
Proper data dashboard management can help you monitor performance, track new trends, and make informed business decisions. When choosing a dashboard for your business needs, it’s essential to understand the different types of dashboards—there are three main types to consider:
- Strategic dashboards
- Operational dashboards
- Analytical dashboards
Strategic dashboards
A strategic dashboard is a compact and focused visual representation of the performance of your organization, department or any other business unit. As the name suggests, strategic dashboards emphasize high-level performance indicators that enable organizations to monitor their progress toward long-term goals.
The primary purpose of strategic management dashboards is to provide insight into which factors drive profitability and what areas an organization should focus on to achieve its strategic objectives. They’re dynamic as they capture new data points from a variety of sources and display them graphically, usually on one screen. Some strategic dashboards include many KPIs and metrics but in general they capture 5 or 6 key performance indicators that measure different aspects of the business.
Operational dashboards
Operational dashboards, also called monitoring dashboards or monitoring kits, are tools that help executives monitor the performance of business processes. They do this by capturing data for managing operations that have a shorter time limit (daily or weekly) and that frequently change.
Operational dashboards are primarily used for process improvement activities. They provide information about what is happening right now so that improvements can be made through changes in workflow procedures or processes based on real-time measurements from the monitoring system.
Such dashboards aren’t usually used for digging deeper into data. They’re used just to show the current performance of key metrics and KPIs.
Analytical
Analytical dashboards combine the best of both worlds: they’re visual, just like a regular dashboard, and also enable users to dig deeper into analytics, acquiring a broader picture of a company’s strategy.
Analytical dashboards differ from strategic and operational dashboards because they focus on monitoring data to explore as much information as possible rather than using that data to drive decisions. They can be used for analyzing historical data to explore new trends, compare the data, and create predictions and targets.
Wrapping up all the information about the three types of data dashboards, here is what we’ve got:
| Strategic dashboards | Operational dashboards | Analytical dashboards |
| Monitor long-term strategies (30 days / 6 months / a year). | Monitor short-term operations (daily / weekly). | Depend not on the time frames, but on acquiring as much information and analytics as possible. |
| Focus on displaying the critical information – goals, critical measures, projects, etc. | Focus on monitoring the current performance of key metrics and KPIs and the progress towards a pre-set goal. | Focus on uncovering meaningful insights, exploring trends and opportunities, predicting results (both positive and negative). |
Bonus: Tips on creating your business data dashboard
To create an effective data dashboard, you must understand how it works and what makes it good or bad. Here are some tips on how to create effective dashboard management, so that next time you’ll hit the mark from the get-go.
Tip #1. Make a list of questions you want to find answers to
Whether you work in an industry or a company that uses data, it’s important to have a good understanding of where the data is and what information you need. Data analysis can be tricky, so it’s important to have a plan before diving into the numbers.
Before you get started with creating your data dashboard, it’s important to identify the questions you want it to answer. That way, once you know what information you need, it’s much easier to create something that has a particular purpose and answers those questions specifically.
Tip #2. Be specific
Creating a dashboard with relevant information is the first and most important step you need to make. Many businesses analyze their data only to end up with something that looks like a wall of numbers, charts, graphs and tables that no one can understand or find what they’re looking for.
Choose the data sources and fields that are essential for decision-making and store only the necessary information. Too much information within one dashboard will only be confusing, and viewers will struggle to find the relevant information they need in a timely manner. There’s no formula for what your dashboard needs to look like or how many graphs you should use. Instead, focus on creating an environment that makes sense for your organization and its needs.
Tip #3. Keep your dashboard minimalistic
Today’s data visualization best practices are based on the principle of simplicity. A shiny new dashboard should pique your curiosity, not stress you out. That’s why keeping things simple is essential for creating data visualization that works.
Look at any minimalist design – let’s take an apartment or a home, and you’ll see how less can in fact be more. The same goes for your data dashboard management; it doesn’t need to be jam-packed with information in order for users to understand your data. In fact, the simpler it is, the easier people will find to understand it.
Tip #4. Choose the right visualization
Without the right visualizations, your dashboard is unlikely to provide much value. If you think of an entire dashboard as a machine, visualization is its primary cog. Therefore, selecting the right visualization for your data will be instrumental in helping to get actionable insights from it.
Data visualizations are tools that help us present data more clearly and effectively. There are many different types of visualizations that can be used to analyze data and communicate its key points effectively. Each type of visualization is useful for a specific set of circumstances and has its own strengths and weaknesses.
📌 Note: Data visualizations can make your data more appealing and easier to understand. But it’s important not to overdo it. If you include too many visualizations on your data dashboard, it’ll be confusing.
What industries or businesses might benefit from using dashboards more than others?
With the advent of analytical dashboards, the corporate landscape has witnessed a paradigm shift, empowering decision-makers to make data-driven choices with unprecedented speed and precision. While the potential benefits of these intuitive tools span across various sectors, there are specific industries where the impact of analytical dashboards is nothing short of revolutionary.
Ecommerce – to analyze vast amounts of customer data
One such industry poised to reap substantial rewards from the utilization of analytical dashboards is the ever-evolving realm of e-commerce. In this digital battleground, where competition reigns supreme, the ability to swiftly and accurately analyze vast amounts of customer data can make or break a company’s success. Analytical dashboards serve as the virtual eyes and ears of e-commerce enterprises, providing a comprehensive overview of crucial metrics, such as customer behavior patterns, sales trends, and inventory management. By harnessing the power of real-time data visualization, these dashboards arm online retailers with the necessary arsenal to optimize marketing strategies, enhance customer experiences, and ultimately boost their bottom line.
The finance industry – to simplify complex financial data
The finance industry, another domain fueled by numbers and complex calculations, also stands to gain immensely from the integration of analytical dashboards. With its labyrinthine networks and rapid market fluctuations, the financial sector demands instantaneous access to up-to-the-minute information. In the midst of this financial frenzy, an analytical dashboard acts as a beacon of clarity, simplifying complex financial data and offering valuable insights that can inform investment decisions, risk assessments, and portfolio management. Through the lens of an analytical dashboard, traders, investors, and financial institutions can navigate the intricate maze of economic indicators, market sentiment, and regulatory changes, allowing them to stay ahead of the game in this cutthroat industry.
Healthcare – to decipher intricate patterns within patients’ health data
The healthcare sector, with its labyrinth of patient records, medical research, and operational logistics, is another prime candidate for the analytical dashboard revolution. Traditionally, healthcare professionals have been burdened with the task of sifting through mountains of data manually, a laborious process that leaves little room for error. However, with analytical dashboards at their disposal, doctors, nurses, and administrators can effortlessly access critical information, visualize patient trends, and streamline workflows. This newfound ability to decipher intricate patterns within healthcare data can have a profound impact on treatment outcomes, resource allocation, and operational efficiency, ultimately saving lives and improving the overall quality of care.
Conclusion: Why you need a data dashboard
With so many new business software programs out there, you may be wondering if a data dashboard is something your company needs. The short answer is yes!
Data dashboards create a connection between distinct yet related metrics, identify loopholes, explore trends and unveil potential challenges that exist behind the bars of the given data.
If you still have doubts, here are key reasons why every business needs a data dashboard.
- Answering critical business questions
Data is a powerful tool for addressing crucial business questions. To thrive in a data-driven environment, businesses require easy access to information and rapid insights. An effective data analytics solution fulfills these needs by providing accessible and actionable data, enabling quicker decision-making and a comprehensive overview of business performance.
- Interactivity and flexibility
Data dashboards offer customization options to cater to your company’s specific requirements. Tabs with filters allow users to target and explore relevant information. Users can dive into details or view aggregated data at a glance, easily switching between different views and activating preset filters to explore diverse datasets.
- Real-time analysis and alerts
Data serves not only as information but also as a powerful means of understanding and improving performance of a business. A well-designed dashboard provides real-time information, automatically updating numbers. It also displays alerts to draw attention to areas that need improvement or require reconsideration of strategies.
- Enhanced forecasting
In the face of abundant data, data dashboards make the information manageable and valuable to your company. With proper insight and analysis, data can be leveraged to achieve goals more efficiently and forecast future business standing based on existing numbers.
Creating an effective dashboard goes beyond simply displaying statistics and figures. It requires transforming data into a compelling narrative that is both interesting and valuable. A data-driven approach coupled with thoughtful data visualization is crucial to analyze and present data in a meaningful way, making the dashboard understandable to everyone.
Thus, a well-designed dashboard is an indispensable tool for businesses, providing valuable insights, real-time analysis, improved forecasting capabilities, and a comprehensive performance overview.