As a business owner or entrepreneur, one of your most important goals is maximizing revenue. This can be done in multiple ways through increasing sales and cutting costs, but understanding marginal revenue (MR) is the prerequisite of your success. In simple words, MR is the additional revenue you earn from selling one more unit of a product or service.
This article will help you calculate your MR and use it to make informed decisions about your business. Whether you’re a seasoned business owner or just starting out, we’ll provide you with the knowledge you need to maximize your income and achieve your business goals.
Enhance your business efficiency by automating your KPI tracking with an analytics tool. Streamline your data management and gain insightful analytics effortlessly – make the smart move to optimize your performance metrics today!
Contents:
2. How to calculate marginal revenue
3. Why is marginal revenue important?
4. Common mistakes of marginal revenue calculation and how to avoid them
5. Taking your ecommerce business revenue to the next level with Synder Insights
What is marginal revenue?
Marginal revenue is the extra income a business gets from selling one more unit of a product or service. It’s like asking, “If I sell one more item, how much more money will I make?” This concept helps businesses decide how many products to make and at what price to sell them to maximize their profits.
In a broader way, MR sn’t about the total income a company earns but about the incremental or additional revenue generated from selling one extra unit. It focuses on the immediate financial benefit of increasing sales by a single unit.
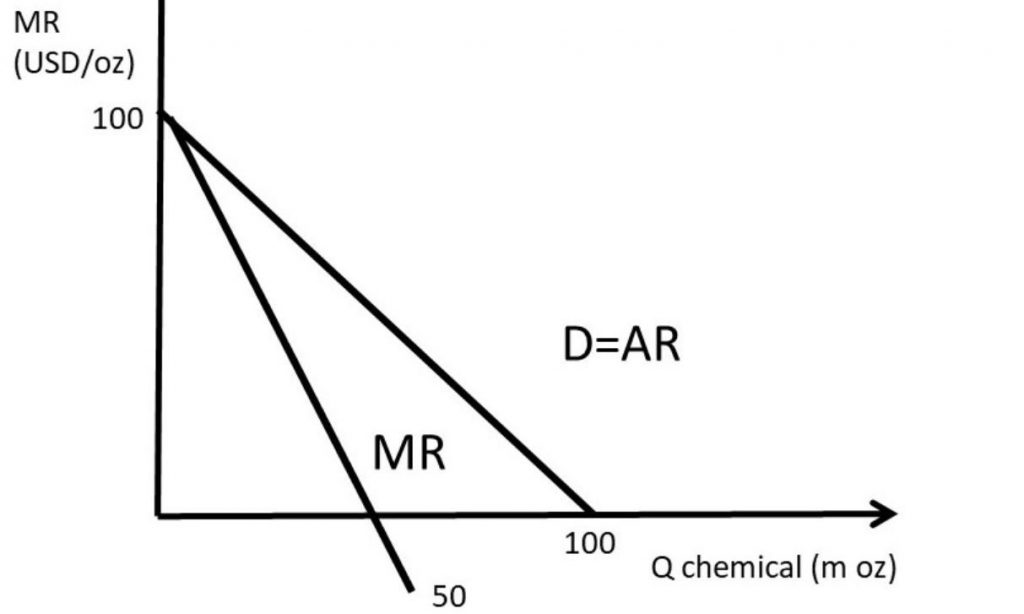
MR can vary depending on the number of units sold and the company’s pricing strategy. In competitive markets where a firm is a price taker, MR is typically constant and equal to the price of the product. However, in less competitive markets, like monopolies, the MR can decrease as the quantity sold increases due to the need to lower prices to sell more units.
Firms aim to produce up to the point where the MR of producing an additional unit equals the marginal cost of producing it. This is called the point of profit maximization.
For example, let’s say you sell T-shirts for $20 each. If you sell 100 T-shirts, your total revenue would be $2,000. If you sell one more T-shirt for $20, your total income will increase to $2,020. The MR earned from selling one more T-shirt is $20.
Knowing the MR helps businesses understand the value of each additional unit sold.
How to calculate marginal revenue: Marginal revenue formula
Calculating MR involves understanding how changes in sales volume affect total revenue.
1. Determine the initial total income.
Calculate the total revenue before the change in quantity. Total revenue (TR) is calculated as the price per unit (P) multiplied by the quantity sold (Q). So, TR = P × Q.
2. Calculate the new TR.
Calculate the new TR after the change in quantity (due to increased production, a change in pricing, or other factors). Again, use the formula TR = P × Q, but this time with the new values for price and quantity.
3. Find the change in total revenue.
Subtract the initial TR from the new total revenue to find the change in TR. This is ΔTR (Delta TR), where Δ represents the change.
4. Determine the change in quantity sold.
Find out how many additional units were sold (or less, if quantity decreased). This is ΔQ, the change in quantity.
5. Calculate MR
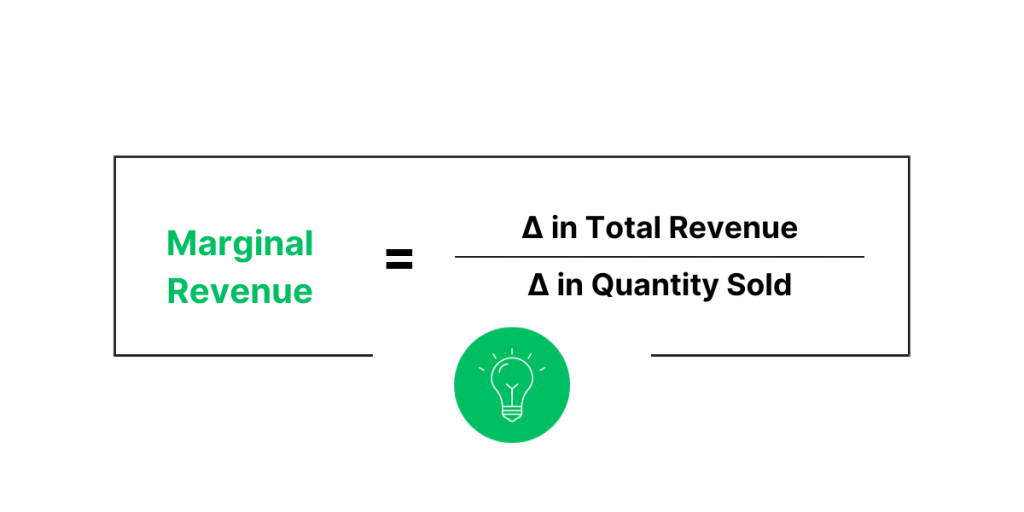
Divide the change in total revenue (ΔTR) by the change in quantity sold (ΔQ). So, MR = ΔTR / ΔQ.

Marginal revenue example
Let’s create an example to illustrate MR for an ecommerce business selling t-shirts.
Assume the ecommerce business sells T-shirts online. The current selling price of each T-shirt is $20. The company sells an average of 100 T-shirts per day, generating a TR of $2,000 per day (100 T-shirts x $20 each).
To increase sales, the company decides to implement a marketing campaign. After the campaign, the sales increase to 110 T-shirts per day. However, to attract more customers, the price per T-shirt is reduced to $19.
Marginal revenue formula calculation
Before the campaign, TR was $2,000 per day (100 T-shirts x $20 each). After the campaign, total revenue is $2,090 per day (110 T-shirts x $19 each).
- Change in TR: The change in total revenue is $2,090 – $2,000 = $90.
- Change in quantity sold: The change in the quantity sold is 110 – 100 = 10 T-shirts.
- Marginal revenue: MR is the change in TR divided by the change in quantity sold. So, MR = $90 / 10 = $9.
The MR of $9 means that for each additional T-shirt sold, the company earns an additional $9 on top of its previous income. This information is crucial for the business as it helps understand whether the marketing campaign and price reduction are beneficial in terms of revenue per additional unit sold.
The company can use this information to decide whether to continue the marketing campaign or adjust the pricing strategy. Suppose the marginal cost of producing and selling each additional T-shirt is less than $9. In that case, the company is making a profit on each additional T-shirt sold, and it might be a good strategy to continue the campaign. The company may need to reassess its strategy if the marginal cost is higher.

What does it mean if marginal revenue is negative?
If MR is negative, it means that the additional income generated from selling one more unit of a product is actually less than the revenue generated before selling that unit. In other words, each additional unit sold decreases the TR. This situation can occur in certain market conditions, especially where lowering the price to sell more units significantly impacts the overall revenue. Here are a few key points to understand:
- Negative MR often occurs in scenarios where a company has to reduce its price significantly to sell additional units. This can happen in markets with high elasticity of demand, where the quantity demanded is highly sensitive to changes in price.
- In markets that aren’t perfectly competitive, like monopolies or oligopolies, firms may face a downward-sloping demand curve. As they lower prices to sell more, the additional revenue from new sales may not be enough to offset the revenue lost due to the lower price on all the units sold. This leads to a decrease in TR.
- Negative MR can indicate that a market is becoming saturated, meaning that the potential for revenue growth through increased sales volume is limited or declining. It can signal that the company is pushing sales beyond the optimal market demand for its product at its current price.
- When a company faces negative MR, it’s a signal to reassess its pricing strategy and sales volume. Increasing production or sales in this scenario can lead to diminishing returns and potentially losses.
- In terms of profit maximization, a negative MR suggests that the company has surpassed the optimal production level where marginal cost equals marginal revenue. To maximize profit, the firm should reduce its output until MR equals marginal cost again.
Why is marginal revenue important?
How to determine the optimal production level
MR can also be used to make better production decisions. By understanding the MR, businesses can determine the level of production needed to maximize profits.
Businesses, once again, can use MR and marginal cost to determine the optimal level of production. The optimal level of production is where the MR equals the marginal cost.
For example, let’s say a business produces 100 cupcakes for $50 in total cost. If the MR for selling one more cupcake is $2 and the marginal cost of producing one more cupcake is $1, the optimal level of production would be to produce more cupcakes until the marginal revenue equals the marginal cost. In this case, the business would want to produce more cupcakes until the MR is $1.
Check out how data-driven insights can help you grow your business.
Pricing strategy
One of the main uses of marginal revenue is to determine the optimal pricing strategy for a business. By understanding the MR, businesses can identify the price point where they can maximize profits.
A business can use MR to determine the optimal price point by comparing it to the marginal cost. Marginal cost is the cost of producing one additional unit of a product or service. The optimal price point is where the MR equals the marginal cost.
For example, a business sells cupcakes for $2 each. If the marginal cost of producing one more cupcake is $1, then the optimal price point will be where the MR equals $1. If the business sells a cupcake for $2 and the marginal cost is $1, the MR will be $1. If the business lowers the price to $1.50, the MR will be $0.50. This means that the business will need to sell more cupcakes to make up for the decrease in price.
Marketing strategy
Marginal revenue can also be used to improve marketing strategies. By understanding the MR, businesses can identify the most profitable products and services to promote.
For example, let’s say a business sells t-shirts and hats. If the MR for selling one more t-shirt is $20 and the MR for selling one more hat is $10, the business should focus its marketing efforts on promoting t-shirts.
The business can maximize its profits by focusing on the product with the higher MR. This way, you can make sure you advertise popular products and achieve better ROAS.
Profit maximization
The core of many business strategies is maximizing profit, and understanding MR is key to this. Businesses aim to produce and sell up to the point where the cost of producing one more unit (marginal cost) equals the revenue it’ll bring in (MR). This point is where profits are highest, as any additional production would add more to costs than to revenues.
Forecasting and planning
MR is a critical component in financial forecasting and strategic planning. It helps businesses project future revenues and understand how changes in production or market conditions might affect these revenues. This understanding is essential for long-term planning, budgeting, and making strategic decisions about investments and growth.
Adapting to consumer demand
In today’s rapidly changing markets, understanding how shifts in consumer demand affect MR helps businesses stay competitive. It allows companies to quickly adapt their production and pricing strategies in response to changing consumer preferences, economic conditions, or competitor actions, ensuring they remain aligned with market demands.
Common mistakes of marginal revenue calculation and how to avoid them
When calculating MR, several common mistakes can lead to inaccurate results or misinterpretations. Here are some of these mistakes and tips on how to avoid them:
Confusing total and marginal revenue
Mistake: Assuming that TR and MR are the same or directly proportional.
How to avoid: Remember that MR refers to the revenue from selling one additional unit, not the TR from all units sold. It’s the incremental revenue, not the cumulative total.
Ignoring the context of the market
Mistake: Not considering the type of market (e.g., perfect competition, monopoly) when interpreting MR.
How to avoid: Understand the market structure in which the business operates. In perfect competition, MR equals the price, but in imperfect markets, it varies with each additional unit sold.
Overlooking price changes
Mistake: Calculating MR without accounting for changes in price that can affect demand.
How to avoid: Take into account how price changes influence the quantity demanded and, consequently, the revenue generated from selling additional units.
Incorrectly calculating changes in revenue and quantity
Mistake: Miscalculating the change in total revenue (ΔTR) or the change in quantity (ΔQ).
How to avoid: Ensure accuracy in determining both the initial and new TR, as well as the initial and new quantities, before calculating their respective changes.
Using averages instead of marginals
Mistake: Using average revenue instead of MR.
How to avoid: Distinguish between average revenue (total revenue divided by quantity) and marginal revenue (change in revenue divided by change in quantity).
Neglecting non-linear relationships
Mistake: Assuming a linear relationship between quantity and revenue in all cases.
How to avoid: Recognize that in many real-world situations, the relationship between quantity sold and revenue isn’t linear, especially in imperfectly competitive markets.
Misinterpreting negative marginal revenue
Mistake: Assuming that negative MR always indicates a loss.
How to avoid: Understand that negative MR indicates a decrease in TR with the sale of additional units, but this doesn’t necessarily mean the company is making a loss. It’s a signal to reassess pricing and output strategies.
Ignoring marginal costs
Mistake: Focusing solely on MR without considering marginal costs.
How to avoid: Always consider marginal costs in conjunction with MR for decision-making, as the intersection of these two is crucial for determining profit maximization.
Taking your ecommerce business revenue to the next level with Synder Insights
If you’re looking for ways to grow your ecommerce business and supercharge your marketing efforts with up-to-date data, it’s time to start using automated software.
Synder Insights is an automated analytics tool that provides you with real-time data on a single dashboard so that you can draw insights from one source of truth and make better decisions about your ecommerce business. Connect all your sales and payment channels and get access to actionable KPI reports on your revenue, product and customer performance.
With Synder Insights, you’ll know your revenue at any moment. You’ll be able to break down the reports by channel time period, and customize it to your needs. The tool will also allow you to find new ways of increasing revenue with product bundling, spot seasonal trends, understand your customers better, and much more.
Sign up for a 15-day free trial to test Synder yourself, or check out how the software can help you know the real numbers of your business by booking a spot at the Weekly Pulic Demo with one of our specialists. Unlock the true potential of your ecommerce business!
Wrapping up marginal revenue: Importance of total revenue and quantity sold
Maximizing revenue is a top priority for businesses. By understanding MR, businesses can make informed decisions about pricing, production, and marketing strategies.
Calculating marginal revenue is a simple process once you know the formula. By using the relationship between MR and marginal cost, businesses can determine the optimal price point and level of production needed to maximize profits. What’s more, with the MR analysis, businesses can focus on promoting the most profitable products and services.
Using the right analytics software will help you keep tabs on the most important KPIs for your business and ensure your revenue is always controlled. By drawing insights from your performance and incorporating MR analysis into your business strategy, you’ll take your business to the next level and maximize profits.


