
An ecommerce P&L statement is the clearest window you have into whether your business is actually making money. For online sellers, reading it correctly can mean the difference between scaling a profitable operation and growing into a loss you only notice months later.
Ecommerce finances are more layered than traditional retail. You’re dealing with platform fees, returns, fulfillment costs, digital marketing spend, and potentially multiple sales channels, all of which need to land somewhere on your income statement. Industry data shows that while the average gross margin for ecommerce businesses sits at around 45%, the average net profit margin drops to roughly 10% after accounting for marketing, fulfillment, and operational expenses. That gap between what looks like a healthy top-line margin and what actually reaches the bottom line is exactly what a well-structured P&L helps you understand and close.
From this article, you’ll learn what an ecommerce P&L includes, how to read every line item, and how to use it to make smarter financial decisions.
TL;DR
- What a P&L is: An ecommerce P&L statement summarizes revenue, costs, and profit over a set period: monthly, quarterly, or annually.
- How it’s structured: The statement flows from gross sales down through COGS, operating expenses, and other costs to arrive at net income.
- Why ecommerce P&L is different: Returns, platform fees, fulfillment costs, and digital ad spend create line items that standard P&L templates don’t always account for.
- How to use it: Comparing P&L statements across periods and tracking margins reveals where your business is gaining or losing ground.
- How Synder helps: Synder automates the syncing of ecommerce transaction data into your accounting software, keeping your P&L accurate without manual data entry.
What is an ecommerce P&L statement?
A profit and loss statement, also called an income statement or P&L, is a financial report that summarizes a company’s revenues, costs, and expenses over a specific period of time. For ecommerce businesses, it answers one central question: after accounting for everything it costs to sell and operate, how much did you actually keep?
It’s worth knowing how the P&L fits alongside your other financial statements.
- The balance sheet is a snapshot – what your business owns and owes at a single point in time.
- The cash flow statement tracks real cash moving in and out.
- The P&L is the performance report – the one you read to understand whether the business is heading in the right direction and where costs are getting out of hand.
For ecommerce sellers specifically, that last part matters more than most people expect. Platform fees, ad spend, payment processing charges, returns, and fulfillment costs all eat into revenue in ways that don’t always surface in a Stripe payout summary or a Shopify dashboard. The P&L pulls every one of those costs into a single, structured view, so you can see not just what you sold, but what you kept.
Key components of an ecommerce P&L
Understanding the structure of the P&L is the first step to using it well. The statement flows top to bottom, with each section building directly on the one before it.
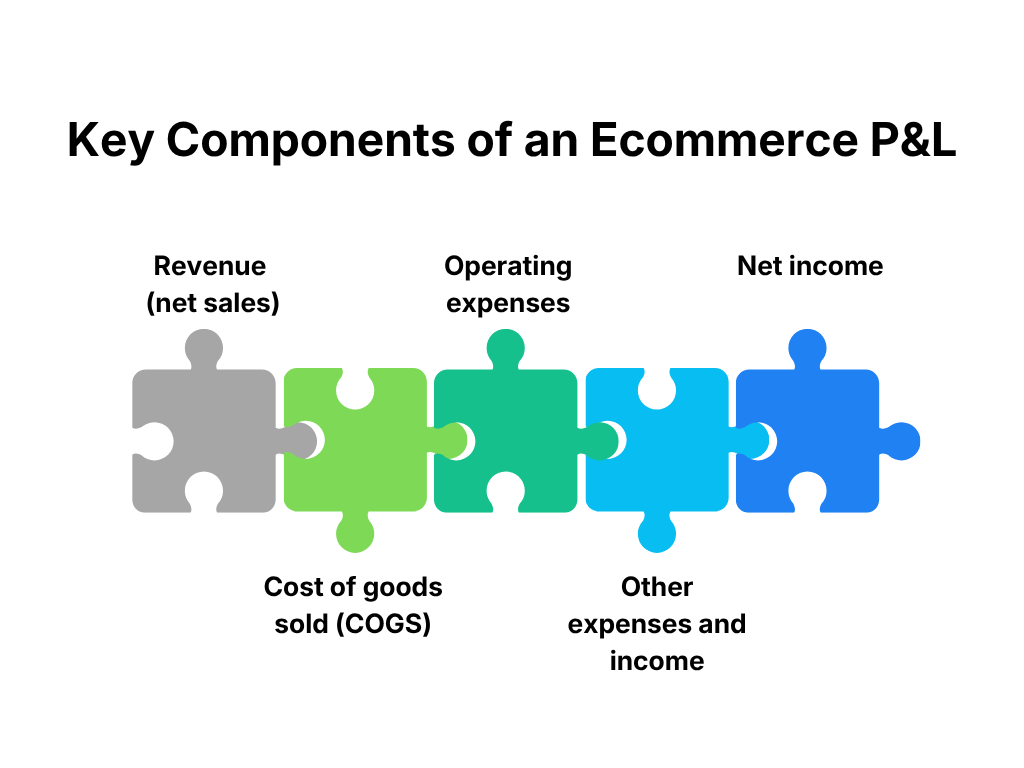
Revenue (net sales)
Revenue is the starting point: the total income your ecommerce store generates from selling products or services in a given period. For ecommerce, it’s important to distinguish between gross revenue and net revenue. Gross sales is the total before any deductions; net sales is what you’re left with after subtracting returns, refunds, discounts, and chargebacks.
A well-structured ecommerce P&L shows this as:
Gross Sales – Returns – Discounts = Net Revenue
Showing net revenue instead of gross gives you an accurate picture of what’s actually coming in. If a business reports $500,000 in gross sales but has a 20% return rate, the working number is closer to $400,000, and every margin calculation downstream should start from there.
If you sell across multiple channels, like Shopify, Amazon, and a direct website, for example, it’s worth breaking revenue down by channel. Different platforms carry different cost profiles, so knowing where revenue comes from lets you evaluate profitability at the channel level, not just the business level overall.
Cost of goods sold (COGS)
COGS represents the direct costs of producing or acquiring the products you sell. For an ecommerce business, this typically includes:
- product cost (manufacturing or wholesale purchase price)
- inbound shipping and freight
- packaging materials
- fulfillment costs tied directly to each unit sold
COGS doesn’t include marketing, software subscriptions, salaries, or overhead – those belong in operating expenses. Keeping COGS limited strictly to direct production costs allows you to calculate gross profit cleanly, which is the key metric for understanding product-level economics:
Net Revenue – COGS = Gross Profit
Learn more about how to calculate cost of goods sold.
Gross profit margin – gross profit expressed as a percentage of net revenue – is one of the most widely tracked figures in ecommerce finance. Industry benchmarks put the average ecommerce gross margin at around 45%, but the actual range is wide:
- apparel and fashion typically land between 40–60%
- electronics run leaner at 20–40%
- digital or software products can reach 70–80%+ given minimal production costs
Tracking COGS in your accounting software is what makes this calculation reliable; when COGS data is missing or inconsistently recorded, the gross profit figure becomes meaningless.
Operating expenses
Operating expenses cover the costs of running the business that aren’t tied directly to producing the product. For an ecommerce company, these typically include:
- Marketing and advertising: paid search, social ads, influencer fees, email marketing platforms
- Platform and transaction fees: Shopify subscriptions, Amazon seller fees, payment processing charges
- Shipping and fulfillment: outbound shipping, returns processing, and warehouse fees where not already captured in COGS
- Salaries and contractor fees: customer service, warehouse staff, operations
- Software and tools: accounting software, inventory management, helpdesk platforms
- General and administrative: legal, accounting fees, office costs
Gross Profit – Operating Expenses = Operating Profit (EBIT)
Operating profit, sometimes called EBIT, earnings before interest and taxes, shows how profitable the core business is before financing costs and tax obligations. It’s the number that tells you whether the business model itself is working, separate from how it’s financed.
Other income and expenses
Below operating profit, you’ll find interest income or expense, depreciation and amortization, and any one-time or non-operating gains or losses. These line items are less significant for smaller ecommerce businesses but become important as companies scale, take on debt, or make capital investments.
Net income
Net income is the bottom line – what remains after every cost has been accounted for, including taxes.
Operating Profit – Interest – Taxes = Net Income
Net income is the number that confirms whether the business is profitable. Strong revenue with negative net income means costs are outpacing what the business generates. Conversely, a business with modest revenue and tight cost control can produce healthy net income. This is why reviewing the full statement, not just the top line, is what separates reactive financial management from a deliberate one.
P&L structure at a glance
| Line item | What it includes | Key formula |
| Gross revenue | All sales before deductions | — |
| Net revenue | After returns, discounts, and chargebacks | Gross revenue – returns – discounts |
| COGS | Direct product and fulfillment costs | — |
| Gross profit | Revenue after direct costs | Net revenue – COGS |
| Operating expenses | Marketing, platform fees, salaries, software | — |
| Operating profit (EBIT) | Core business profitability | Gross profit – OpEx |
| Net income | Final bottom line after interest and taxes | EBIT – interest – taxes |
What makes an ecommerce P&L different
A standard income statement template covers the basics, but it won’t reflect the specific cost structure of an ecommerce business without some adaptation. A few areas deserve particular attention.
Returns and refunds
Ecommerce return rates are structurally higher than in physical retail. According to NRF data, online return rates averaged 16.9% of sales in 2024, compared to roughly 5% for in-store purchases. If returns aren’t clearly deducted from gross revenue, or if the associated processing and shipping costs aren’t captured somewhere in operating expenses, your P&L will overstate profitability.
Platform and marketplace fees
Selling on Amazon, eBay, or other marketplaces means a meaningful slice of revenue goes back to the platform before you see it. Amazon’s referral fees alone typically range from 8–15% of the sale price, depending on the category. These should appear clearly in operating expenses rather than buried in a miscellaneous line. If you’re running a multichannel business, making these fees visible by platform is what allows you to evaluate the true margin contribution of each channel.
Digital advertising spend
For direct-to-consumer ecommerce brands, marketing costs can represent 20–30% of revenue or more. On the P&L, this means advertising spend often outweighs every other individual operating expense category. Tracking it at a channel level – paid search vs. social vs. influencer – gives you visibility into customer acquisition cost against margins, and lets you make informed decisions about where to scale and where to pull back.
Multichannel revenue complexity
If you’re selling across Shopify, Amazon, eBay, and a direct website simultaneously, you’re receiving payouts from multiple processors, on different schedules, in different formats. Without accounting automation, mapping all of that revenue accurately to the right period is genuinely difficult.
How to handle ecommerce P&L complexity
The honest answer to most of the problems above is automation, and finance teams know it. According to Synder’s 2025 Finance Automation Report, a survey of 424 senior finance leaders across ecommerce and SaaS, 97.4% agree that AI and automation deliver measurable impact, and 92.46% plan to increase automation in their workflows in 2025. The repetitive, error-prone work of syncing transaction data across channels, categorizing fees, and reconciling payouts at month-end is precisely the kind of task automation is built to handle.
Synder is a strong option for ecommerce businesses dealing with this complexity. It’s an accounting automation platform that connects platforms like Shopify, Amazon, Stripe, and PayPal directly to accounting software: QuickBooks Online, Xero, NetSuite, Sage Intacct, and Puzzle, and handles the parts of P&L management that tend to break down in practice.
On the revenue side, Synder maps every payout to the right period and the right channel, so your net sales figure reflects actual transactions rather than processor timing. It separates platform fees, refunds, and shipping income into distinct line items automatically, so those costs appear where they belong in your P&L and don’t get absorbed into a lump sum.
Smart Rules let you build automated categorization logic: if Amazon’s storage fees should always land in a specific expense account, that happens without anyone touching it manually.
How it works in practice
A good illustration of what this looks like at scale: Dermeleve, an over-the-counter skincare brand selling across Shopify, Amazon, Stripe, and wholesale, was managing 170,000+ transactions across four channels with a CFO who needed full P&L visibility without a full accounting team. After connecting their channels through Synder to QuickBooks Online, they achieved 99.5%+ reconciliation accuracy across all four platforms and saved $60,000–$72,000 annually in deferred staffing costs – the equivalent of the additional accounting headcount the business would otherwise have needed to handle that transaction volume accurately.
If you’re managing sales across multiple channels and finding your P&L hard to manage, start a free trial with Synder or book a demo with the team and walk through your specific setup.
How to read and use your P&L: a cheat sheet
Having an accurate P&L is step one. Knowing what to do with it is step two. Here’s a quick reference for the five moves that turn a monthly report into an actual management tool.
| What to do | Why it matters | What to watch for |
| Track margins, not just revenue | Revenue can grow while profitability shrinks | Gross margin declining quarter over quarter signals a cost problem, not a revenue one |
| Compare periods | A single P&L is a snapshot; trends are what drive decisions | A Q4 revenue spike with a Q1 margin cliff is a pattern worth understanding before you reforecast |
| Use the % of revenue method | Expresses every cost as a share of net sales – makes categories comparable across periods | COGS above 65% leaves thin room to cover OpEx profitably |
| Break revenue down by channel | Different platforms carry different margins – a blended view can mask a loss-making channel | High revenue on a channel with low net contribution often means platform fees, commissions, or ad spend are eroding what looks like a strong line |
| Read it alongside the balance sheet and cash flow | Profit on the P&L doesn’t always mean cash in the bank | Positive net income with declining cash usually means collections lag or inventory is building up |
Common mistakes that distort your P&L
Even financially experienced business owners repeat the same errors. Here are the most common ones and how to fix them.
- Reporting gross revenue instead of net revenue. Returns, refunds, and discounts need to come off before anything else. Skipping this overstates the top line and distorts every margin calculation downstream. Fix: always start your P&L from net sales, with returns and discounts as explicit deductions.
- Inconsistent COGS classification. Including fulfillment costs in COGS one quarter and moving them to operating expenses the next makes period-over-period comparisons meaningless. Fix: define your COGS categories once and apply them consistently – document the logic so anyone touching the books uses the same rules.
- Pulling data from payment processor exports. Stripe, PayPal, and Shopify summaries are not income statements. They don’t account for timing differences, accruals, or costs that don’t flow through the processor. Fix: run your P&L from a properly configured accounting system with ecommerce data synced accurately to your books, not from platform dashboards.
- Burying fees in miscellaneous. Platform commissions, transaction fees, and ad spend lumped into a catch-all line make it impossible to evaluate channel profitability. Fix: map each fee type to a dedicated expense account so costs are visible and comparable across periods.
- Ignoring timing differences. Revenue recorded when payment is received rather than when it’s earned can shift profit between periods and produce misleading monthly figures. Fix: use accrual accounting, not cash basis, for your P&L, especially if you run promotions, subscriptions, or pre-orders.
Putting it together: your P&L as a management tool
An ecommerce P&L statement is far more than a compliance document or a tax-season checklist item. Reviewed consistently and set up correctly for the nuances of online retail, like net revenue, proper COGS capture, channel-level breakdowns, and accurate operating expense categorization, it becomes the financial instrument you use to run the business.
The businesses that grow profitably are almost always the ones that know their numbers at this level of detail. They know their gross margin by product category, their customer acquisition cost relative to lifetime value, and how each sales channel contributes to the bottom line. The P&L is where that knowledge lives. Getting it right isn’t complicated, but it does require a setup that keeps your data accurate without demanding hours of manual reconciliation each month.
FAQ
What is a P&L in ecommerce?
A P&L, or profit and loss statement, is a financial report that summarizes an ecommerce business’s revenues, costs, and expenses over a set period. It shows whether the business is profitable and is also called an income statement.
What is PNL in ecommerce?
PNL and P&L refer to the same thing: the profit and loss statement. It outlines gross sales, cost of goods sold, operating expenses, and net income – the full picture of financial performance over a period.
What is the 80/20 rule in ecommerce?
The 80/20 rule suggests that roughly 80% of revenue typically comes from 20% of products or customers. In a P&L context, it’s a prompt to analyze which products or channels generate the most profit, and to allocate costs accordingly rather than spreading resources evenly.
What is an ecommerce income statement?
An ecommerce income statement is another name for a P&L statement. It records net revenue, COGS, gross profit, operating expenses, and net income, adapted to reflect costs specific to online retail, such as platform fees, returns, and digital advertising spend.
How do you manage an ecommerce P&L to make it profitable?
Focus on gross margin first: reduce COGS or adjust pricing to improve the gap between revenue and direct costs. Then review operating expenses as a percentage of revenue – identify categories growing faster than revenue and investigate. Track returns separately so their true cost is visible. Compare statements across periods to identify trends rather than reacting to single-month figures.
What are the 4 types of ecommerce?
The four main models are B2C (business to consumer), B2B (business to business), C2C (consumer to consumer, such as marketplace reselling), and D2C (direct to consumer). Each carries a different cost structure on the P&L: D2C businesses, for example, tend to carry higher marketing costs, while B2B businesses may have longer payment cycles that affect cash flow.