Running a business, you might not have deep accounting expertise (like that to earn a certificate), but at least understanding the basics allows you to speak the same language as your accountant and understand what’s happening with your business finance-wise. The chart of accounts is one of those basic of the basics. It’s a fundamental accounting framework you use to organize your financial records and build reporting around. So, you should know how to handle and read it.
Let’s look at the anatomy of the chart of accounts – what it comprises, why you need it, and what goes where within this framework.
Contents:
1. Introduction to the chart of accounts: the concept of accounts and general ledger
2. How do you structure a chart of accounts?
8. Additional accounts in the chart of accounts
9. Accounts numbering in the chart of accounts
10. Why is chart of accounts important for efficient finance management?
11. Let’s look at some sample chart of accounts
12. How the chart of accounts became a standard practice?
Key takeaways
- The chart of accounts (COA) is a standard framework that helps organize a company’s funds into different categories for easier management.
- Basic accounts in the COA include things like what the company owns (assets), what it owes (liabilities), how much it’s worth to its owners (equity), where it gets money from (revenue), and what it spends money on (expenses).
- The COA is critical because it helps everyone understand how the company is doing financially. It shows where the money is coming from and where it’s going and helps make wise decisions about spending, saving, and profitability.
Introduction to the chart of accounts: the concept of accounts and general ledger
The chart of accounts (COA) is a list of accounts a company uses to record its financial transactions.
It works as a guide to all the components a business employs to categorize and log financial activities within its accounting framework. The chart of accounts helps you organize your transactions into a convenient view of how the money moves through your business.
To understand the chart of accounts, you might want to look at the concepts of accounts and general ledger.
What is an account?
We’ll start with accounts, as they form the basis for the chart of accounts. If you’re an accounting professional, you don’t have any trouble understanding what accounts mean in accounting. However, less finance-savvy people might confuse them with actual bank accounts. So, we need to clarify it.
In accounting and bookkeeping, we use the term accounts for categories under which you typically record your business’s financial activities.
The chart of accounts deals with the five main categories, or, if you will, account types. We’ll look at them a bit further.
What is a general ledger?
Meanwhile, let’s look at the general ledger real quick because general ledger uses the accounts listed in the chart of accounts to record and organize financial transactions. The chart of accounts, at this point, serves as a structure under which the general ledger operates.
The general ledger is the central hub where all financial transactions are recorded. It contains individual account summaries, showing debit and credit entries to each account.
Let’s stop here for a moment and break them down.
Every transaction affects at least two accounts – one gets debited and another credited. It’s how double-entry bookkeeping works. Double-entry bookkeeping is a fundamental requirement for recording financial transactions under GAAP (Generally Accepted Accounting Principles), so you can’t record your transactions differently.
Debiting and crediting are essentially changing the balances of different accounts to reflect business activities. Debiting increases certain accounts’ balances and decreases others while crediting has the opposite effect.
Here’s how it works.
When a company purchases inventory on credit, the Inventory account is debited to increase it, and the Accounts Payable account is credited to record the liability to pay for the inventory in the future.
Back to the general ledger, it’s where all this commotion happens. A general ledger stores a detailed record of a company’s financial activities, facilitating the preparation of financial statements and performance analysis.
If you remember those large accounting books of old times where you would write all the transactions, like how much you sold, earned, spent, and so on – that’s what the general ledger is. The only difference is that today, you don’t need pen and paper (or quill and paper, though I like that idea) and use accounting software (or any other electronic means of accounting) to do your books.
Done with that, let’s look at the chart of accounts structure.
Want to turn your accounting into a powerfull business management tool? Consider integrating it with all your sales sources and payment systems to create a single source of truth about your business finances. And here is where Synder can help. Book your seat at our free Weekly Webinar of try Synder with a 15-day free trial to see how it can help you manage your business more efficiently.
How do you structure a chart of accounts?
In the United States businessesand organizations widely use a standardized chart of accounts. This standardization is particularly relevant when dealing with transactions such as the IRS Treas 310 Tax Ref, as it ensures that all financial activities are categorized correctly for tax purposes and compliance.
The standard chart of accounts requires you to present your finances divided into several groups – accounts – representing various aspects of your business activities. These accounts follow a strict order, each having its place. So, when setting up your accounting system, you create the COA in this order.
The basic set of accounts is similar for all businesses, regardless of the type, size, or industry. This way, whether you’re setting up restaurant bookkeeping or ecommerce accounting, you follow the standard chart of accounts.
Let’s look at it.
What are the 5 types of accounts?
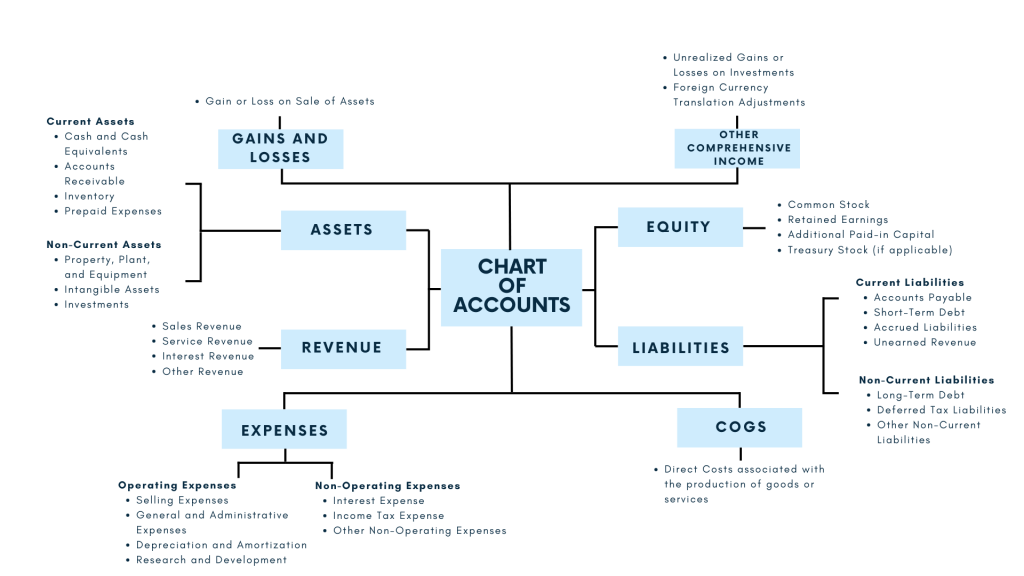
The chart of accounts typically includes five standard accounts. They are assets, liabilities, equity, revenue, and expenses.
We often call the assets, liabiliies and equity accounts the balance sheet accounts, as they participate in forming a company’s balance sheet. The remaining revenue and expenses accounts fall into the profit and loss accounts, as they appear in this financial statement.
Within each category, there are specific accounts that represent different types of transactions, so there are always a number of subaccounts within each account. It’s also worth saying that depending on the idustry and a business’s structure, more accounts can form the COA.
Some businesses can indicate COGS, gain and losses, etc., as separate accounts to structurize their finances even more granuarly.
Let’s look at these accounts in more detail.
1. Asset accounts
Simply put, assets are resources a company owns. These resources have economic value and are expected to provide future benefits. These can include cash, inventory, equipment, buildings, and investments.
You can have multiple asset accounts, each representing a different type of asset.
Let’s look at the most typical asset accounts.
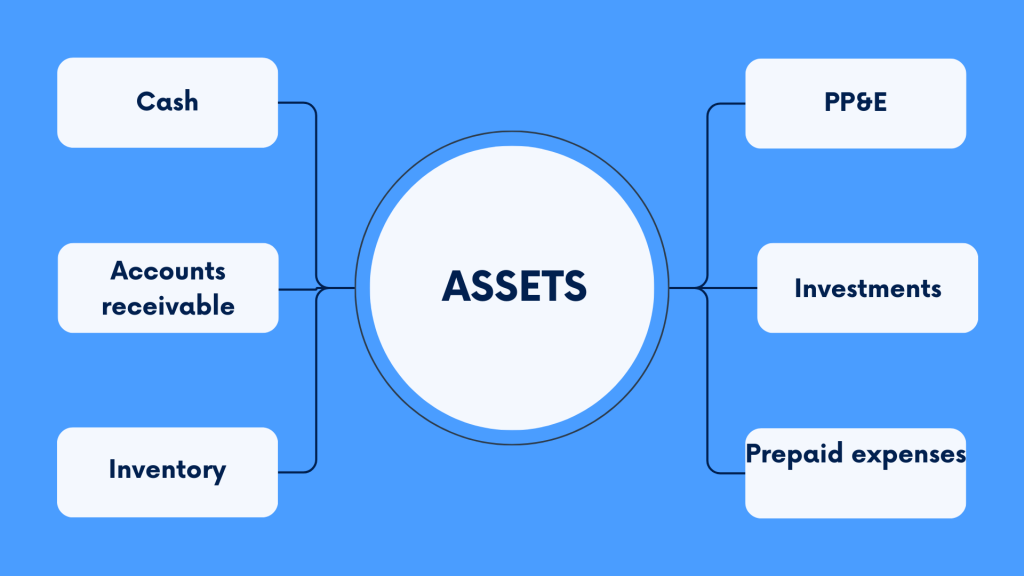
- Cash – the amount of money a company has on hand or in bank accounts.
- Accounts Receivable – money the company expects to receive from customers for goods or services provided on credit.
- Inventory – the total cost of goods held for sale in the ordinary business course.
- Property, Plant, and Equipment – tangible assets such as buildings, machinery, and vehicles used in the company’s operations. (Tangible is the word for something that exists in a physical form and can be seen, touched, and measured.)
- Investments – stocks, bonds, and other securities held for investment purposes.
- Prepaid Expenses – expenses paid in advance, such as insurance premiums or rent.
All these asset accounts fall into either current or non-current assets.
Current assets are a company’s possessions it plans to convert into cash or use up within a year, like cash, inventory, and accounts receivable. Non-current assets are things a company owns but won’t convert to cash shortly, like property, equipment, and long-term investments.
Where to find assets in a financial statement?
You can usually find your assets on the balance sheet (one of the three standard business financial statements) that provides a snapshot of a company’s financial position at a specific moment. Assets are listed on the balance sheet in order of liquidity (the term to denote how easily and quickly an asset can be turned into cash without losing its value). The most liquid assets (such as cash) are listed first, followed by less liquid assets (such as inventory and PP&E).
The total assets amount represents the value of all the company’s resources. In other words, it’s everything the company owns.
2. Liabilities accounts
Liabilities are the amounts of money a company owes to others or the obligations it needs to fulfill in the future. Think of debts to suppliers, loans from banks, or unpaid expenses – they are your liabilities.
You can have multiple liability accounts in the COA, representing different types of your obligations.
So, what are those liability accounts?
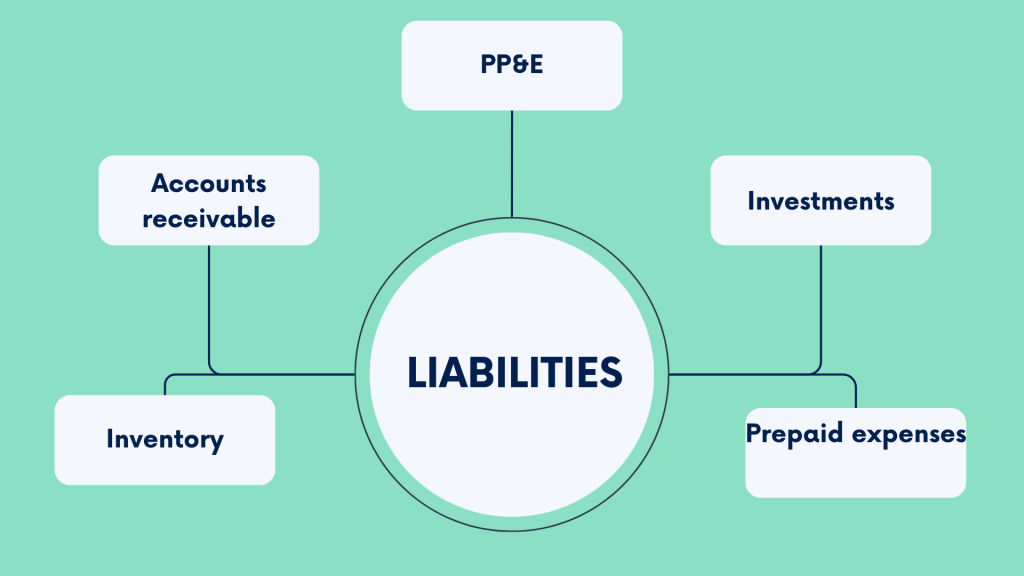
- Accounts Payable – money you owe suppliers or vendors for goods or services purchased on credit.
- Loans Payable – money you borrowed from banks or other lenders and should repay over time.
- Accrued Expenses – unpaid money for obligatory planned expenses a company incurs as part of its regular operations. Some examples are salaries and utilities. In other words, the money you already know you’ll spend in this period.
- Notes Payable – money you owe under formal agreements to repay borrowed money.
- Taxes Payable – amounts owed to tax authorities, such as your income tax or sales taxes collected from customers.
Similar to assets, liabilities can be current and non-current. Current liabilities are short-term debts (a company should pay off within a year), like bills and short-term loans. Long-term loans or leases and other long-term obligations (usually due beyond a year) are non-current liabilities.
Where to look for liabilities in reports?
In financial statements, liabilities are typically found on the balance sheet. Liabilities are listed alongside assets, representing the company’s financial obligations. The total liabilities reflect the company’s debts and obligations that need to be settled in the future.
3. Equity accounts
Equity is the ownership value in a company, determined by subtracting liabilities from assets. In simple terms, it’s what you have in the business as a company owner (or one of the company owners) or, often, an investor.
Equity can fall into several accounts, reflecting different aspects of ownership in the company.
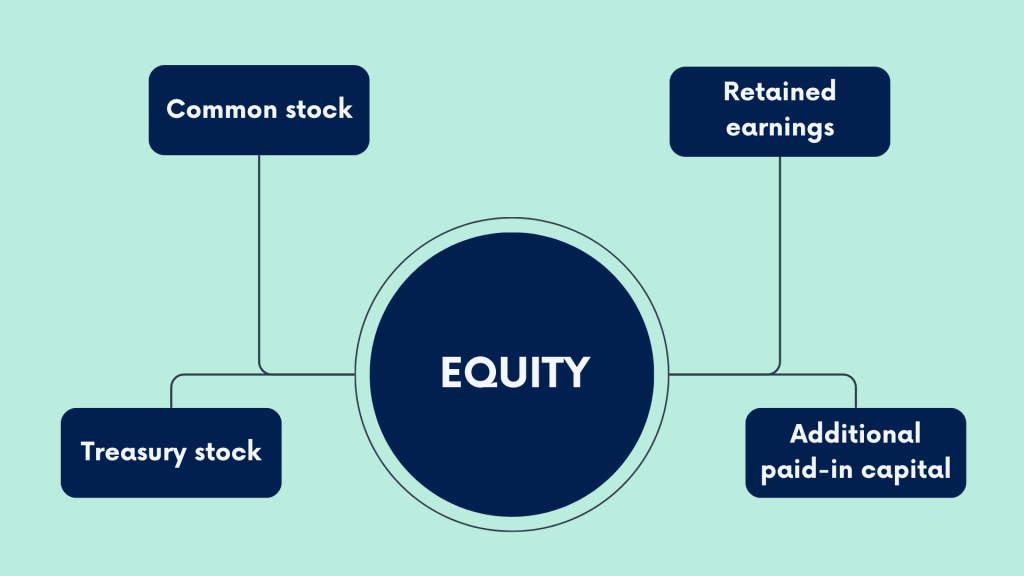
- Common Stock – the initial investment made by shareholders in exchange for ownership shares in the company.
- Retained Earnings – the cumulative net income earned by the company that has not been distributed to shareholders as dividends.
- Additional Paid-In Capital – any amounts received from shareholders over the minimum price at which shares can be issued by a company (par value of the stock).
- Treasury Stock – shares of the company’s stock that have been repurchased from shareholders.
Where’d you go to find equity?
As mentioned above, equity is one of the so-called balance sheet accounts, as it appears in the balance sheet. Equity is listed alongside liabilities, representing the shareholders’ stake in the company’s assets. The total equity amount reflects the company’s net worth or book value, which is the value of the assets minus the liabilities.
4. Revenue accounts
When speaking of revenue, we usually mean the income a company earns from its primary business activities, such as selling goods or providing services. It’s the total money generated from these activities before deducting any expenses.
The revenue accounts appear based on the source of where the income comes from.
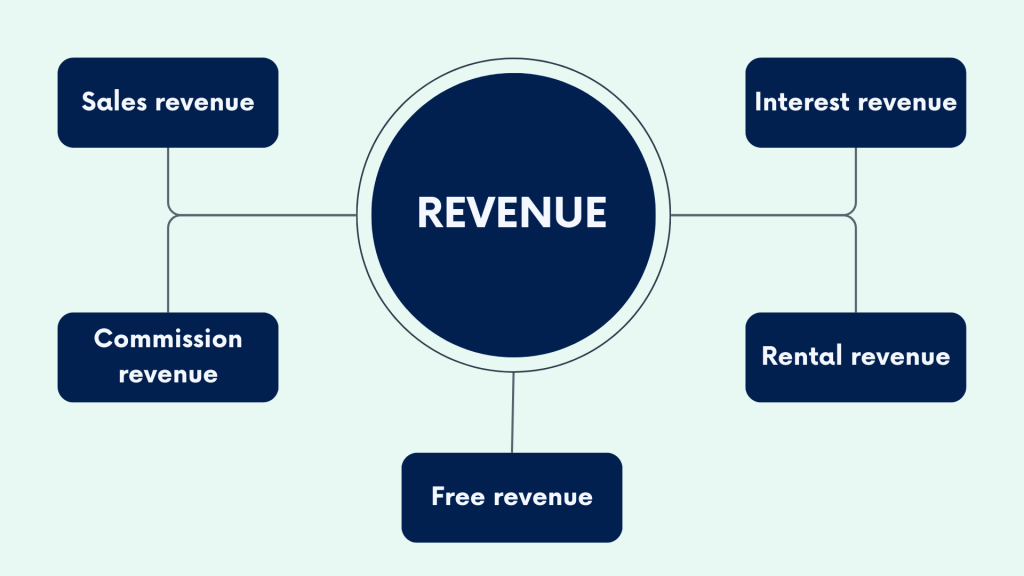
- Sales Revenue – the money you get from selling goods or services to customers.
- Interest Revenue – the means you earn from interest income on loans, investments, or deposits.
- Rental Revenue – the income from renting out property or equipment.
- Fee Revenue – the money you earn for the provided services, such as consulting or subscription fees.
- Commission Revenue: – the money you get from sales commissions or brokerage fees.
Where does the revenue show up?
Revenue is typically found on the income statement of financial statements (that’s why it’s named as one of the profit and loss accounts), which shows a company’s financial performance over a specific period, such as a month, quarter, or year.
Revenue appears at the top line of the income statement, showing the total amount of money earned from sales or other business activities. It reflects the company’s ability to generate income from its core operations, indicating its financial health and growth potential.
5. Expenses accounts
Expenses are the means a company spends to generate revenue and operate its business. They can be the money spent on resources and activities necessary to keep the business running smoothly.
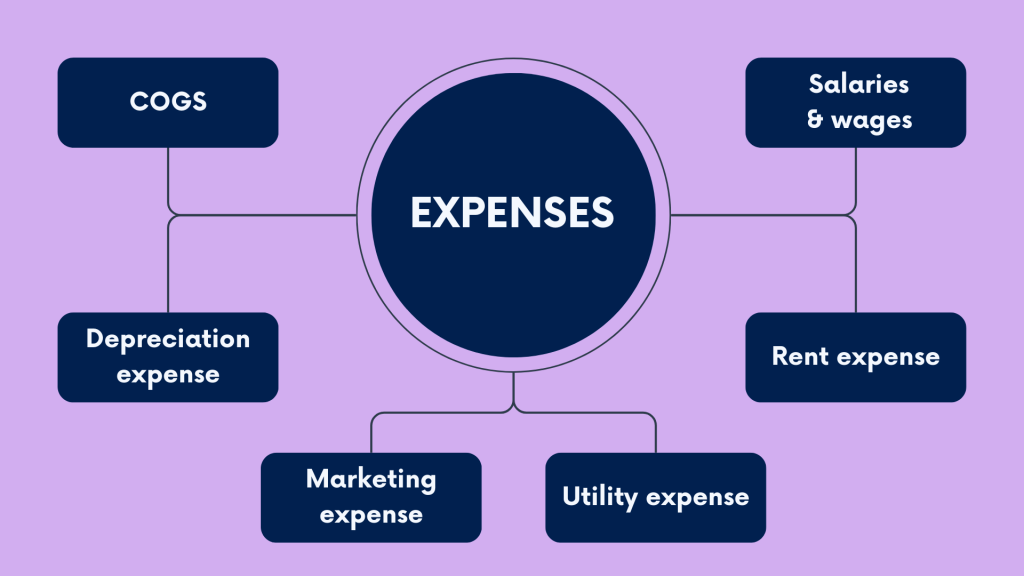
- Cost of Goods Sold (COGS) – the direct costs associated with producing or purchasing the goods sold by the company.
- Salaries and Wages – the compensation paid to employees for their work.
- Rent Expense – the cost of renting or leasing property for the company’s operations.
- Utility Expense – the spending on essential services like electricity, water, and gas.
- Advertising and Marketing Expense: – the money spent on promoting the company’s products or services.
- Depreciation Expense – the allocation of the cost of assets over their useful lives.
A company’s expenses can be operating and non-operating.
Operating expenses are the costs needed to run a business day-to-day, for example, rent and salaries. Non-operating expenses are not that directly tied to running the business. They can be interest on loans or losses from selling assets, etc.
Where can you find expenses in reporting?
Expenses are typically found on the income statement alongside revenue. Expenses are subtracted from revenue to calculate net income – the company’s profit or loss in the period in question.
Besides, analyzing your expenses in the income statement allows you to assess your company’s profitability, see where you might be overspending, and can optimize to improve financial health and operational efficiency.
Additional accounts in the chart of accounts
As mentioned, besides the standard five accounts, the chart of accounts may contain additional accounts, created for the sake of more granularity or to cater to a business’s particular needs. They can vary, but the most typical here are the COGS, gains and losses, and other comprehensive income accounts.
Cost of Goods Sold (COGS)
As mentioned, COGS represents the direct costs associated with producing or purchasing the goods that a company sells. It’s an expense account. However, many businesses prefer to separate COGS to track the expenses directly related to production outside other operating expenses. It helps get a clearer picture of the profitability of their products or services.
Other Comprehensive Income
Other Comprehensive Income includes gains and losses that have not yet been realized but are included in shareholders’ equity. Separating Other Comprehensive Income allows businesses to track changes in the value of certain assets or liabilities over time.
Gains and Losses
Gains and losses represent the money earned or lost from activities outside the company’s primary operations. For example, gains from the sale of assets or investments or losses from currency exchange fluctuations. Separating gains and losses allows businesses to analyze the impact of these non-operating activities separately from core business operations.
So, separating these additional accounts allows businesses to understand the specific drivers of their financial performance in more detail.
Accounts numbering in the chart of accounts
As mentioned, all accounts in the COA are typically arranged in a hierarchical order for easy navigation and reporting. A certain way of numbering accounts is used to reflect the hierarchy. It often follows a pattern where the first digit represents the major category, and subsequent digits provide more detail.
For example:
- 1000-1999 usually go to the Assets category;
- 2000-2999 go to Liabilities;
- 3000-3999 are the numbers for Equity;
- 4000-4999 are the numbers for the Revenue category;
- 5000-5999 is the numeration for the Cost of Goods Sold accounts;
- 6000-6999 are the numbers assigned to Operating expenses;
- 7000-7999 are the numbers for Non-Operating expenses
- 8000-8999 are the numbers the Other comprehensive income category possesses;
- 9000-9999 go to Gains and losses.
The specific accounts and their numbering may vary by company, industry, or specific accounting standards adopted. It’s also common to have sub-accounts for more detailed tracking. Regular updates to the COA may be necessary to reflect changes in the business structure or accounting requirements.
Accounting software can facilitate standardization, providing pre-defined templates that align with generally accepted accounting principles (GAAP). This helps ensure consistency and comparability in financial reporting.
Why is chart of accounts important for efficient finance management?
So, a chart of accounts, as mentioned, organizes a company’s finances in an easy-to-understand way. It helps everyone in the company know exactly where the money is coming from and where it’s going.
By sorting transactions into specific categories, it helps create accurate financial reports, which are super important for making decisions and showing outsiders, like investors or regulators, how well the business is doing.
It also helps managers plan budgets and see which business areas are making money and which might need extra attention.
Plus, keeping an eye on different expense types helps the company control its costs and ensure money is spent where it matters most. And when it comes to audits (those thorough checks of financial records), having a clear COA makes everything a lot easier, keeping everyone happy and following the rules.
Let’s look at some sample charts of accounts
Now, let’s explore a couple of the COA examples for businesses in various industries – online retail, manufacturing, and service businesses. We presume they accept online payments via payment platforms (for example, Stripe, Paypal, or Square). You might also notice that there are specificities of the business that might affect the COA structure. But let’s proceed and look at the examples.
#1 – An online retailer
In an online retail business, tracking inventory is essential for effective management. The chart of accounts, at this point, includes categories like Inventory and COGS to monitor the value of goods in stock and the expenses associated with their sale. As shipping is usually integral to businesses of this type, the COA might also include specific accounts like Shipping revenue and Shipping costs. This way, a company can monitor the financial aspects of shipping. Additionally, the COA accommodates various online payment methods, using corresponding accounts to record received funds more accurately.
| Code | Account Name | Description | To increase |
|---|---|---|---|
| Assets | |||
| 1010 | Cash on hands | Physical cash available. | Debit |
| 1020 | Cash in bank | Cash held in the business’s bank accounts. | Debit |
| 1030 | Accounts receivable | Amounts owed to the business by customers. | Debit |
| 1040 | Inventory | Value of goods available for sale. | Debit |
| Liabilities | |||
| 2010 | Accounts payable | Amounts owed by the business to suppliers. | Credit |
| 2020 | Short-term loans payable | Any short-term loans the business has taken. | Credit |
| 2030 | Credit card payable | Outstanding credit card balances. | Credit |
| Equity | |||
| 3010 | Owner’s equity | Owner’s investment in the business. | Credit |
| Revenue | |||
| 4010 | Product sales | Income from selling products. | Credit |
| 4020 | Shipping revenue | Income from shipping services. | Credit |
| Expenses | |||
| 5010 | Cost of goodc sold | Cost directly associated with producing goods. | Debit |
| 5020 | Shipping costs | Costs associated with shipping. | Debit |
| 5030 | Website maintenance expenses | Expenses related to maintaining the online retail platform. | Debit |
| Online payments | |||
| 6010 | PayPal account | Funds held in the business’s PayPal account. | Credit |
| 6020 | Stripe account | Funds held in the business’s Stripe account. | Credit |
| 6030 | Square account | Funds held in the business’s Square account. | Credit |
#2 – A production (manufacturing) company
In manufacturing, the production process involves different stages, such as raw materials, work in progress, and finished goods. TYou can keep track of these stages with the Raw materials inventory, Work-in-progress inventory, and Finished goods inventory accounts, monitoring the value at each production step.
If the business offers manufacturing services to others, a separate revenue account, Manufacturing services, is included to track income from these services. Just like in online retail, the COA for manufacturing businesses might also include accounts for various online payment systems such as PayPal, Stripe, and Square, ensuring efficient tracking of digital transactions.
| Code | Account Name | Description | To increase |
|---|---|---|---|
| Assets | |||
| 1010 | Cash on hands | Physical cash available. | Debit |
| 1020 | Cash in bank | Cash held in the business’s bank accounts. | Debit |
| 1030 | Accounts receivable | Amounts owed to the business by customers. | Debit |
| 1040 | Raw materials inventory | Value of materials for production. | Debit |
| 1050 | Work-in-progress inventory | Value of partially completed products. | Debit |
| 1060 | Finished products inventory | Value of completed products ready for sale. | Debit |
| Liabilities | |||
| 2010 | Accounts payable | Amounts owed by the business to suppliers. | Credit |
| 2020 | Short-term loans payable | Any short-term loans the business has taken. | Credit |
| 2030 | Credit card payable | Outstanding credit card balances. | Credit |
| Equity | |||
| 3010 | Owner’s equity | Owner’s investment in the business. | Credit |
| Revenue | |||
| 4010 | Product sales | Income from selling products. | Credit |
| 4020 | Manufacturing services | Income from providing manufacturing services. | Credit |
| Expenses | |||
| 5010 | Cost of raw materials | Cost of materials used in production. | Debit |
| 5020 | Labor costs | Costs associated with the workforce. | Debit |
| 5030 | Manufacturing overhead | Indirect production costs. | Debit |
| Online payments | |||
| 6010 | PayPal account | Funds held in the business’s PayPal account. | Credit |
| 6020 | Stripe account | Funds held in the business’s Stripe account. | Credit |
| 6030 | Square account | Funds held in the business’s Square account. | Credit |
#3 – A service company
Service businesses earn income by providing services. The COA, in this case, might include revenue accounts like Service fees and Consulting revenue to track earnings. An expense account named Professional fees can be added to monitor costs for hiring professionals. Marketing expenses is another expense account to track promotional costs. The COA also includes accounts for online payment systems to monitor digital transactions.
| Code | Account Name | Description | To increase |
|---|---|---|---|
| Assets | |||
| 1010 | Cash on hands | Physical cash available. | Debit |
| 1020 | Cash in bank | Cash held in the business’s bank accounts. | Debit |
| 1030 | Accounts receivable | Amounts owed to the business by customers. | Debit |
| Liabilities | |||
| 2010 | Accounts payable | Amounts owed by the business to suppliers. | Credit |
| 2020 | Short-term loans payable | Any short-term loans the business has taken. | Credit |
| 2030 | Credit card payable | Outstanding credit card balances. | Credit |
| Equity | |||
| 3010 | Owner’s equity | Owner’s investment in the business. | Credit |
| Revenue | |||
| 4010 | Service fees | Income from providing services. | Credit |
| 4020 | Consulting revenue | Income from consulting services. | Credit |
| Expenses | |||
| 5010 | Marketing expenses | Costs associated with marketing efforts. | Debit |
| 5020 | Professional fees | Costs related to hiring external professionals. | Debit |
| 5030 | Office expenses | General office-related costs. | Debit |
| Online payments | |||
| 6010 | PayPal account | Funds held in the business’s PayPal account. | Credit |
| 6020 | Stripe account | Funds held in the business’s Stripe account. | Credit |
| 6030 | Square account | Funds held in the business’s Square account. | Credit |
How the chart of accounts became a standard practice?
Let’s look back in history to see how people came to the idea of having the chart of accounts as an accounting necessity.
The COA has been a fundamental component of accounting systems for centuries, evolving with accounting practices. While we can’t name the exact date when it became a standard accounting practice, we can trace its evolution through history – from tally sticks to accounting software.
Early days accounting (Middle Ages)
Simple record-keeping systems started appearing in the late Middle Ages and early Renaissance, thanks to merchants and traders who needed to somehow track their transactions and finances. Since not everyone could read or do math well back then, they kept things simple, using pen and paper (or rather quill and paper), tally sticks, tokens, and sometimes even drawings to track what they owed or what was owed to them. Everyone did it their way.
Double-entry bookkeeping (15th century)
In 1494, an Italian mathematician, Luca Pacioli, wrote a book providing suggestions of how merchants could keep their records. It was like the first try to introduce double-entry bookkeeping, being a significant milestone. It brought the concept of recording transactions with corresponding debits and credits, allowing for more accurate financial records. While Pacioli’s work laid the foundation for modern accounting, a standardized chart of accounts had yet to emerge.
Industrial revolution (18th and 19th centuries)
The Industrial Revolution resulted in technological advancements and changes in production methods. Businesses experienced rapid growth and an increase in transactions. At this point, they demanded a more structured and standardized approach to accounting to help them track their finances, manage inventories, control costs, and assess their financial performance.
20th century
In the 20th century, businesses continued to grow. At the same time, the government came up with stricter regulations on how they should keep their finances in order. That inspired the idea of having a standardized way of keeping financial records. Organizations began creating their own lists, called charts of accounts, to categorize and organize their financial transactions systematically. This way, it was easier to follow the rules and regulations set by the government. Another benefit was a more comprehensive view of the business’s finances.
Computerization (late 20th century)
The advent of computers in the latter half of the 20th century changed accounting practices. Computerized accounting systems facilitated the creation and management of extensive charts of accounts. Accounting software allowed for greater flexibility, customization, and efficiency in managing financial data.
International standardization (late 20th century to present)
International accounting bodies, such as the International Financial Reporting Standards (IFRS) and the Generally Accepted Accounting Principles (GAAP) in the United States, have played a role in standardizing accounting practices globally. These standards provide guidelines for financial reporting, including the structure of the COA.
Today, the chart of accounts is an integral element of accounting software, and its use is widespread across various industries and organizations.
Bottom line
To wrap it up, the COA is crucial for businesses to handle their money matters. It helps organize financial information into different categories, like what the company owns, what it owes, and where it gets money from. Knowing the basics of the COA, businesses can better understand their finances and make smarter decisions.
The COA helps businesses manage their money wisely, giving them a tool for keeping track of cash flow, creating accurate financial reports, facilitating budgeting, and cost control. This way, they can stay on top of their finances.
Share your thoughts
Sharing is caring! Please share your thoughts and opinions in the comments section below. We appreciate a good discussion.