
When it comes to measuring progress and assessing performance, understanding the Year to Date (YTD) concept is essential. It is a valuable metric used in various industries and sectors to track financial performance, evaluate business growth, and analyze investment returns.
In this article, we will explore what YTD means, how to calculate it, and how to effectively use it to make informed decisions.
Ready? Let’s start with Year to Date meaning and definition.
Contents:
1. Understanding Year to Date: YTD meaning & definition
2. Year to Date: Fiscal year vs. calendar year
3. Types of YTD
4. How to interpret and calculate YTD
5. Examples of YTD application
7. Potential pitfalls and limitations of YTD
8. Best practices for using YTD
9. YTD vs. other time period metrics: Comparison of Month to Date (MTD) and Quarter to Date (QTD)
10. YTD reporting and visualization
11. Analyze your company performance with Synder
12. Conclusion
13. FAQs
Key takeaways:
- Year to Date (YTD) shows progress from the start of the year to a specific date.
- Calculating YTD involves summing up the data for a chosen metric from the start of the year until the selected date.
- Year to Date is used in finance, accounting, sales, marketing, project management, and personal finance to track performance and make informed decisions.
- Understanding the differences between Year to Date, Month to Date (MTD), and Quarter to Date (QTD) metrics helps in choosing the appropriate timeframe for analysis.
- Clear and concise reporting and visual representation using graphs or charts enhance the comprehension and impact of Year to Date data.
- Automated accounting software like Synder can streamline reporting, visualization, and analysis of YTD data, freeing up time to focus on business growth.
What does Year to Date mean: YTD definition
Year to Date is the period from the beginning of the current year up to a specific date.
In other words, Year to Date is based on the number of days from the beginning of the calendar year (or fiscal year) up until a specified date.
It provides a snapshot of:
- performance,
- growth,
- or returns over that period.
Year to Date is commonly used in:
- finance,
- accounting,
- sales,
- marketing,
- project management,
- and personal finance.
Year to Date allows for a comprehensive analysis of progress within a given timeframe by considering data up to a specific date.
The calculating process involves summing up the data for the chosen metric (e.g., sales, revenue, expenses, investment returns) from the start of the year until the selected date. This cumulative figure provides insights into the performance and growth achieved during that period.
Year to Date: Fiscal year vs. calendar year
The YTD can be used in reference to a calendar year or a fiscal year. This is important to realize, as not all companies follow a fiscal year beginning on January 1.
When this data is used in the context of a calendar year, it covers the period from January 1 to the current date. However, when it’s in reference to a fiscal year, it encompasses the period from the start of the company’s fiscal year to the current date.
For instance, if Company A’s fiscal year begins on January 31 and today is March 30, then:
- Company A’s Calendar YTD would span from January 1 to March 30.
- Company A’s Fiscal YTD would span from January 31 to March 30.
In cases where YTD isn’t explicitly specified to be either a calendar or fiscal year, it’s generally assumed to be referring to the calendar year.
Types of YTD
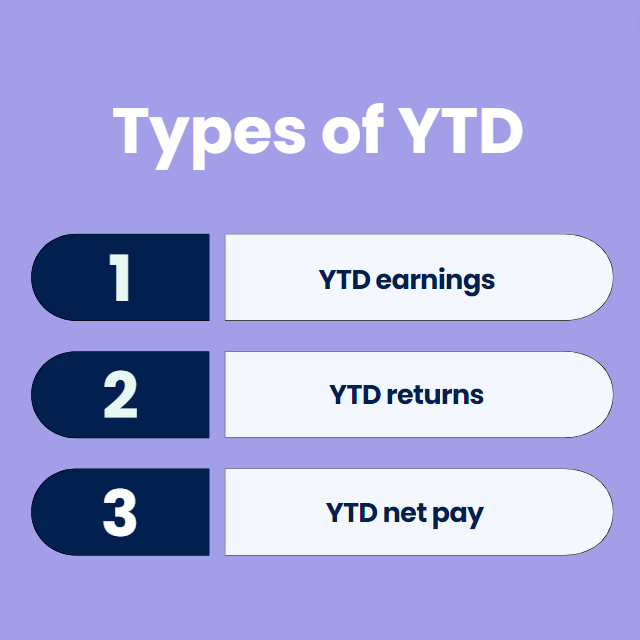
Type 1: YTD earnings
Year to Date earnings refer to the cumulative income or earnings of an individual or entity from the beginning of the calendar year up to the present date. It represents the total amount of money earned within that period, encompassing all sources of income.
YTD earnings can include various forms of income, such as:
- Salary and wages. This includes the regular income received from employment, including base salary, hourly wages, and any additional compensation like bonuses or commissions.
- Self-employment income. If you are self-employed or have a business, those earnings would encompass the total income generated from your business activities, such as profits, fees, or consulting income.
- Investment income. YTD earnings can include income generated from investments, such as dividends from stocks, interest from bonds or savings accounts, capital gains from the sale of depreciated assets, or rental income from properties.
- Other sources of income. YTD earnings can also include income from various sources, such as royalties, freelance work, alimony, or any other form of taxable income received during the year.
Year to Date earnings are important for tracking income, understanding financial progress, and meeting tax obligations. They provide a comprehensive view of the earnings accumulated over a specific timeframe and are often used for budgeting, financial planning, and tax reporting purposes.
Find out how to file income tax return.
Type 2: YTD returns
YTD return refers to the percentage change in the value of an investment or portfolio from the beginning of the calendar year up to the present date. Investors use it to assess the performance of their investments over a specific period and compare them to benchmarks or other investment options. It provides a measure of how an investment has performed during the year thus far, indicating gains or losses relative to the initial investment.
Type 3: YTD net pay
Year to Date net pay is the cumulative amount of income an individual has received after deductions from the beginning of the calendar year up to the present date. It represents the total earnings after subtracting taxes, contributions, and other deductions, which can be found on pay stubs.
On a pay stub, the YTD section typically includes various components, such as:
- YTD Earnings. This includes the total amount an employee has earned throughout the year, including regular wages, overtime pay, bonuses, commissions, and other forms of compensation.
- YTD Deductions. This comprises the cumulative deductions taken from an employee’s earnings during the year. Deductions may include federal and state taxes, Social Security and Medicare contributions, health insurance premiums, retirement plan contributions, and any other authorized deductions.
By displaying the year-to-date figures on a pay stub, employees can track their earnings and deductions over time. It allows them to compare their current pay period’s earnings or deductions with their year-to-date totals, providing a comprehensive view of their income and financial situation throughout the year.
Year-to-date information on a pay stub is especially useful for monitoring tax withholdings and ensuring that the correct amounts are being deducted to meet tax obligations so that come the end of the tax year they won’t have any problems with the IRS. It also helps employees understand their overall compensation and assess their progress towards financial goals.
Learn more about payroll taxes for an employer.
How to interpret and calculate YTD
Year to Date formula
The formula for calculating Year to Date depends on the specific metric or data you are tracking. However, the general YTD formula is as follows:
YTD = Sum of data for the chosen metric from the start of the year up to the selected date
It’s important to note that the calculation may vary depending on the specific context and how the data is structured. Make sure to adapt the formula to suit your specific needs and data format.
YTD calculation steps
To calculate YTD, follow these steps:
Let’s explore what these steps mean:
Step 1. Determine the start date
Identify the beginning of the year or the desired period for calculation.
Step 2. Collect the relevant data
Gather the data points for the chosen metric (e.g., sales, revenue, expenses, investment returns) from the start of the year up to the selected date.
Step 3. Sum up the data
Add up all the data points to obtain the cumulative year-to-date figure.
Step 4. Interpret the YTD result
Compare the YTD value with previous periods, industry benchmarks, or targets to assess performance. Positive growth indicates progress, while negative growth may require further investigation and adjustments.
For example, if you want to calculate the YTD sales for a company up to May 31st, you would sum up all the sales figures from January 1st to May 31st to obtain the sales.
When interpreting that data, consider factors such as seasonality, external events, or market conditions that may impact the results. It’s crucial to avoid drawing hasty conclusions based solely on YTD figures and instead analyze them in conjunction with other relevant metrics and contextual information.
Examples of YTD application
1. YTD in sales and marketing
Sales teams can use YTD to monitor their performance, track sales growth, and identify patterns or trends. Marketing departments can assess the effectiveness of their campaigns by analyzing YTD metrics such as website traffic, lead generation, or conversion rates.
2. YTD in project management
Project managers rely on that data to evaluate project progress, milestones, and adherence to timelines. By comparing YTD project metrics, such as completed tasks or budget expenditures, managers can identify areas of concern and implement corrective measures.
3. YTD in personal finance
Individuals can leverage YTD to manage their personal finances effectively. By tracking YTD expenses, income, and savings, individuals can evaluate their financial health, make adjustments to their budget, and set realistic goals for the rest of the year.
Benefits of utilizing YTD
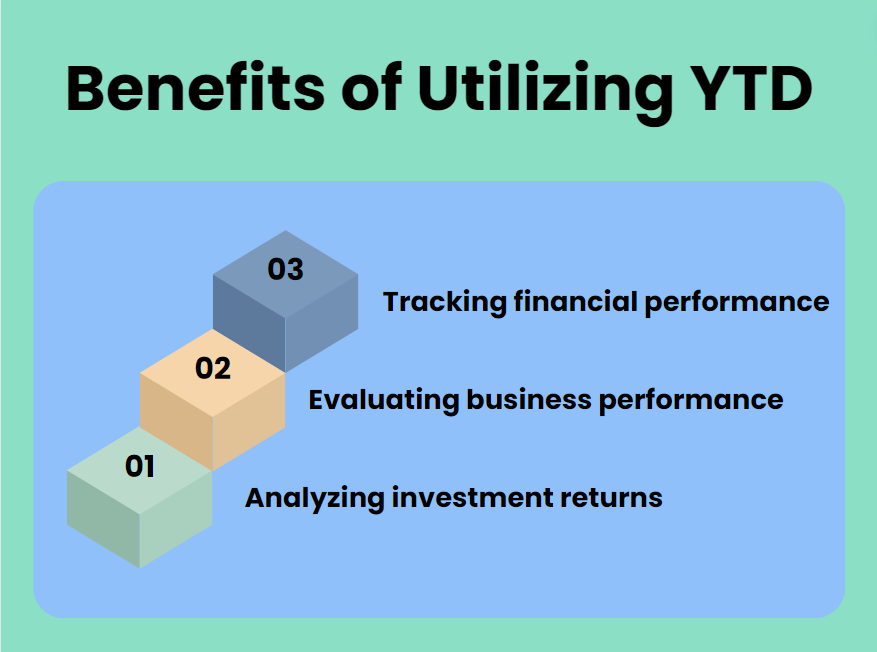
1. Tracking financial performance
YTD helps monitor financial performance by providing a benchmark for revenue, expenses, and profitability. By comparing YTD figures with previous periods or targets, businesses can identify trends, assess growth, and make informed financial decisions.
Similar read: Profit or Profitability: Exploring the Essential Disparities for Business Success
2. Evaluating business performance
YTD serves as a yardstick to evaluate overall business performance. By examining this data, companies can measure progress towards goals, identify areas for improvement, and make adjustments to strategies or operations as needed.
3. Analyzing investment returns
YTD is a useful tool for investors to evaluate the performance of their investments. By comparing the YTD returns of different assets or investment portfolios, investors can assess their investment strategies, make informed decisions, and reallocate resources if necessary.
Potential pitfalls and limitations of YTD
While YTD is a valuable metric, it’s essential to be aware of its limitations.
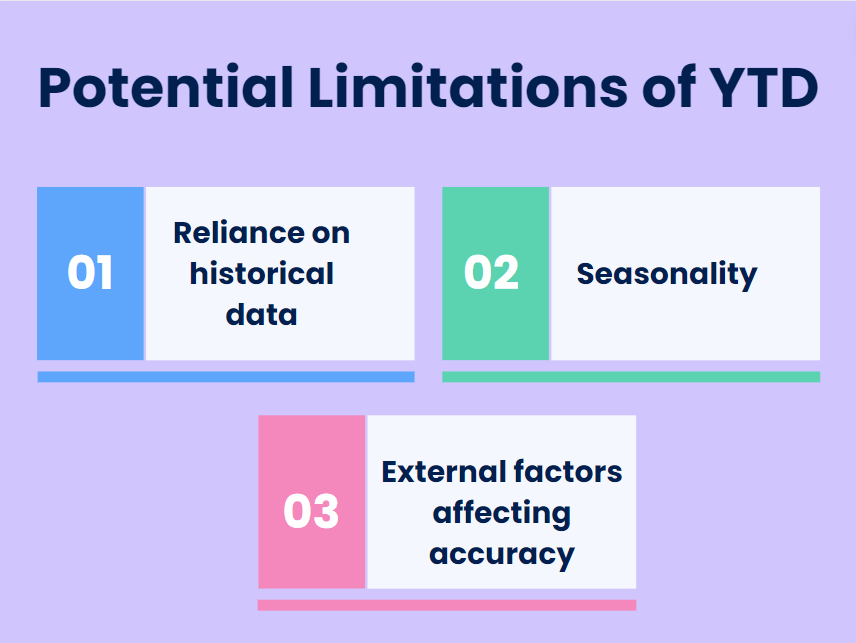
1. Reliance on historical data
YTD is based on historical data, which may not always reflect current market conditions or future performance accurately. External factors, such as economic changes or industry shifts, may impact the reliability of figures.
2. Seasonality
Year-to-date figures may be influenced by seasonal variations. Certain industries experience fluctuations throughout the year, and YTD results should be interpreted with caution, considering the impact of seasonality.
3. External factors affecting accuracy
Calculations may be influenced by external factors like mergers, acquisitions, or changes in accounting methods. These factors can affect comparability and accuracy when comparing YTD figures across different periods or entities.
Best practices for using YTD
To make the most of year-to-date data, consider these best practices:
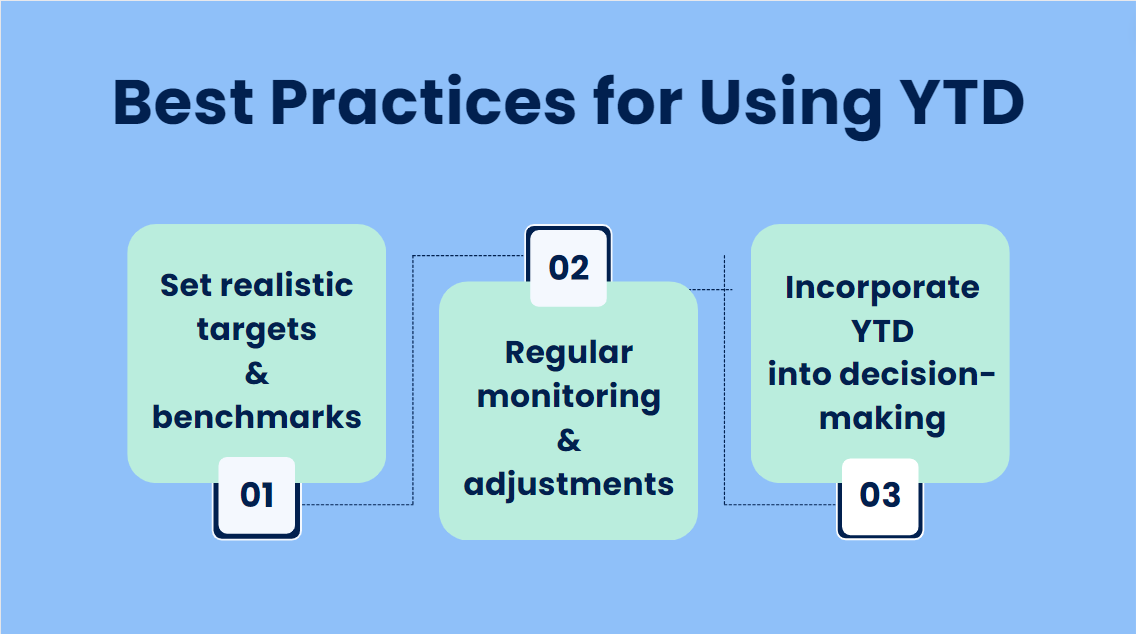
1. Set realistic targets & benchmarks
Establish achievable goals and benchmarks for YTD comparisons. These targets should align with the specific industry, company, or individual context to ensure meaningful analysis.
2. Regular monitoring & adjustments
Continuously monitor YTD data throughout the year. Regularly analyze the performance, identify areas of improvement, and make necessary adjustments to strategies, operations, or investments.
3. Incorporate YTD into decision-making
Utilize year-to-date insights when making decisions. Consider the overall trend, YTD growth or decline, and other relevant factors to ensure informed decision-making.
YTD vs. other time period metrics: Comparison of Month to Date (MTD) and Quarter to Date (QTD)
While YTD provides a comprehensive overview of performance, it’s important to understand the differences between YTD and other time-related metrics, such as Month to Date (MTD) or Quarter to Date (QTD).
MTD focuses on a specific month’s performance, while QTD assesses performance for a specific quarter. In comparison, YTD provides a broader perspective by encompassing the entire year up to a specific date.
Each metric has its advantages and disadvantages, depending on the context and desired level of granularity. Year to Date is often preferred for long-term assessments and benchmarking purposes.
YTD reporting and visualization
When presenting year-to-date data, effective reporting and visualization techniques can enhance comprehension and impact. Consider the following:
1. Clear and concise reports
Present YTD figures in well-structured reports, highlighting key insights, trends, and comparisons. Use visuals, charts, and tables to enhance clarity and understanding.
2. Visual representation
Utilize graphs or charts to visualize data trends and comparisons. Bar charts, line graphs, or stacked area charts can effectively illustrate performance over time.
Analyze your company performance with Synder
Want to have flawless reporting and clear visualization of business results? Take advantage of Synder’s Business Insights – your business’s all-in-one source of truth.
Just connect all your sales channels and payment platforms to Synder and get all major ecommerce metrics on a single dashboard. The metrics are presented in the form of clear-cut reports with insights ready to be interpreted in real-time. The reports span your sales, customers, and products, giving you comprehensive data analytics of all aspects of your business. These can be filtered according to the date or period, channel, location, etc.
Are you curious about how it works? Take a look at the tutorial illustrating how to get instant analytics on your sales and fees from sales channels.
Synder will also provide you with accurate accounting reports – P&L and Balance sheet, which will be created automatically! Best of all, you’ll be able to access them anytime and everywhere, customizing the results with various filters. Synder will automate a significant part of your accounting and help you get rid of a great chunk of manual work so that come the end of the fiscal year, you can rest assured that your books are clean and reports are perfect.
Check out what Synder can do for your business by signing up for a free 15-day trial, or book office hours to see everything with a specialist and ask questions.
With Synder, you can delegate time-consuming accounting tasks to automation and focus on measuring, scaling, and growing your business!
Conclusion
Year to Date is a powerful metric that provides a comprehensive overview of performance, growth, and returns within a specific period. Businesses and individuals can track financial performance, evaluate progress, and make informed decisions by understanding and effectively utilizing YTD.
However, it’s important to consider the limitations, interpret data in context, and incorporate YTD analysis into broader assessments. By employing best practices, leveraging YTD insights, and utilizing smart automated software, you can gain a clearer understanding of your journey and take proactive steps towards achieving your goals.
Learn more about What is Prenote and the definition of PO number.
FAQs
1. What is the Year-to-date in accounting terms?
Year-to-date (YTD) refers to the period beginning on the first day of the current calendar year or fiscal year and ending on the current date.
2. How do I track payments on a Year to Date basis?
To track payments on a Year to Date basis, you’ll need to record all payments made within the specified time frame, typically from the beginning of the calendar year or fiscal year up to the present date. This includes payments for expenses, bills, invoices, and any other financial transactions. You can use accounting software, spreadsheets to organize and monitor your payments effectively.
3. How can I calculate my year-to-date earnings?
Calculating your year-to-date earnings involves adding up all the income you’ve earned from the beginning of the calendar year or fiscal year up to the present date.
This includes salaries, wages, bonuses, commissions, dividends, interest, and any other sources of income received during this time frame. To determine your YTD earnings accurately, gather all relevant financial documents, such as pay stubs, bank statements, and investment statements. Then, add up the total earnings from each source to get your year-to-date earnings.