As a business owner, you know how much effort is needed to create actionable strategies to increase sales and get ahead of the competition. Sometimes, it seems to be an ongoing struggle: making assumptions, testing theories, and trying to predict how this or that action affects your business performance. At this point, shifting your focus to data-driven decision-making seems to be a much wiser approach. Moreover, businesses usually already have all the necessary data. What they might lack is a means to extract valuable insights from the data they possess. And that’s where business intelligence tools can help.
In this article, we’ll delve into business intelligence and BI tools. We’ll also see how ecommerce businesses can leverage them: from a better understanding of business performance to creating more efficient strategies, including marketing, sales, and much more.
Keep reading to learn more about BI:
1. What is business intelligence?
2. The difference between business intelligence and business analytics
3. What are business intelligence tools?
5. Why do ecommerce businesses need business intelligence software?
6. Leveraging business analytics and BI for your ecommerce venture
What is business intelligence?
Before we get to business intelligence tools, we’ll take a look at business intelligence as a concept and define what it means in ecommerce.
In general, business intelligence – often shortened to BI – is a broad term that finds application in different areas as a means of ensuring more efficient decision-making powered by relevant business data. In recent years, it’s acquired wide recognition in the business world, and more companies embrace and implement it. The data that BI operates on, its goals, and objectives may differ slightly, given the specifics of a particular industry.
In a wider meaning, BI denotes the process of collecting and analyzing various business data as well as technical infrastructure that helps perform the analysis and present the results in understandable reports, performance measures, or trend overviews. BI can include various techniques, such as data mining, performance benchmarking, descriptive analytics, and more.
The difference between business intelligence and business analytics
Business intelligence can often be confused with business analytics, which is no surprise, as both concepts imply analyzing business data. So let’s have a look at how business analytics and business intelligence compare and contrast.
At its core, business (data) analytics is about diving deep into data to answer specific questions. Think of it as the detective work on raw data: examining, cleaning, and transforming it to uncover insights. It uses tools like SQL or Python to pinpoint trends and patterns. For example, you might use data analytics to understand why a product isn’t selling in a particular region.
On the other hand, business intelligence is the broader strategy around using data. While it includes the detective work of analytics, its main goal is to apply this data-driven knowledge to your business plans. It’s not just about understanding trends but also about how to leverage this understanding for business success. It guides decisions like market positioning, risk management, and even future forecasting using a blend of analytics tools and more advanced platforms.
In simpler terms, while business data analytics asks “What’s happening in our data?”, business data intelligence wonders “How can we use this understanding for our business’s advantage?”
What are business intelligence tools?
Business intelligence tools (often referred to as BI tools) are software used to fetch, organize, analyze, and visualize data a business acquires through its operations to present trends and patterns influencing business performance in easy-to-digest reports. As a result, they help informed decision-making, powering it with data-driven business insights.
Types of business intelligence tools
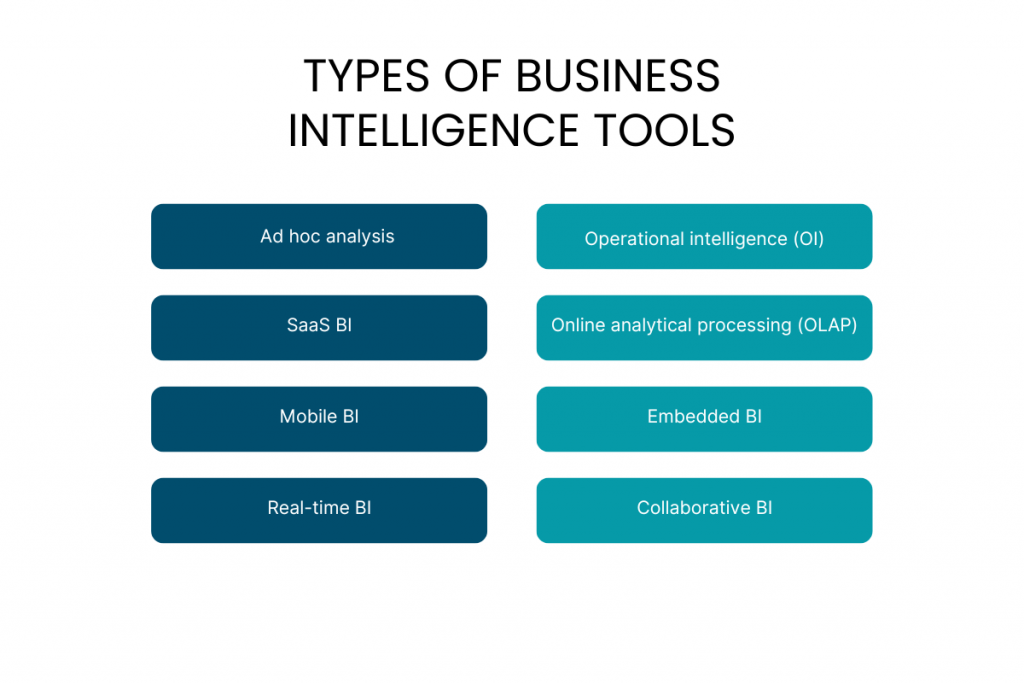
BI comprises a wide range of analytical techniques that allow deciphering the data behind business insights and organizing it into valuable business reports. Besides, they can differ based on the approach to analyzing data, access, and devices they’re compatible with. At this point, we can speak about a variety of types of business intelligence tools available. Here’s a short overview.
Ad hoc analysis
When you need to receive a real quick answer to a specific business question, ad hoc analysis is here to help. Unlike many other BI techniques, it allows for answering specific business inquiries quickly and doesn’t require much analytical expertise. Usually, ad hoc analysis applies to test tactics and powers up short-term decisions like What channel brought you more sales last week? This can be a good example of an ad hoc type of analytics.
Online analytical processing (OLAP)
OLAP is a business intelligence technology that allows for organizing and ad-hoc analyzing large sets of business data from various dimensions. OLAP is capable of complex calculations, trend analysis, and sophisticated data modeling (what-if scenarios). That’s why OLAP usually powers solutions for business performance management, financial reporting, budgeting, financial forecasting, etc.
Mobile BI
Mobile business intelligence – or mobile BI – embraces a wide range of tools that allow accessing and performing BI-related processes on mobile devices and tablets. It facilitates tracking KPIs and other business metrics through mobile dashboards and reporting.
Real-time BI
Real-time business intelligence (RTBI) comprises various analytical instruments and tools that allow for instant aggregation of data from multiple sources, anatomizing it, and delivering highly accurate and up-to-date business insights. RTBI tools enable businesses to quickly capture time-sensitive opportunities, detect potential risks and critical issues early, and quickly apply decisions based on the insights where necessary.
Operational intelligence (OI)
Operational intelligence involves analyzing the business operation data gathered from multiple sources in real time as soon as the data is collected. It helps business owners quickly understand how their company is performing, providing valuable insights into how to improve the operation. The OI tools usually present insights through reports or dashboards.
SaaS BI
As the name denotes, these tools are offered under the SaaS distribution model with flexible pricing, often subscription. Saas business intelligence tools are, at large, cloud-based and hosted by third-party vendors, providing users access to analytics services like dashboards, reports, and data storage in a secure online environment.
Embedded BI
Embedded business intelligence comprises BI solutions and tools that can integrate with the platforms, applications, or portals a business already uses. This is done to manage their operations more efficiently by joining those siloed data sources into a single analytical system. Embedded BI tools allow for comparing and analyzing different data sets from existing business applications using interactive dashboards, reporting, predictive analytics, data analysis, and more.
Collaborative BI
The concept of collaborative BI (collaborative business intelligence) usually implies merging business intelligence software with collaboration tools to encourage better decisions across various teams, giving access to critical business insights to a wider audience. Simply put, such software allows for shared discussion using business intelligence results, helping improve decision-making throughout a company. From discussing specific report findings to including multiple reports in the discussion and pointing at them for insights while working on an issue – businesses can leverage collaborative BI in many ways.
Bottom line
With so many BI software types available, a logical question can be how to define a better fit for your business. And the good old mantra about sticking with your particular business needs might be the best answer. Defining your goals should be the primary thing before choosing BI tools because the choice will directly depend on what you’ll be using BI software for, and how it will fit into your business.
What is ecommerce BI?
As mentioned above, BI is a broad concept that can be used in many industries. But let’s narrow it down to the ecommerce industry and look at how it applies there.
In ecommerce, utilizing a sales tracking tool as part of BI usually provides insights into sales, product performance, and customer behavior, enabling a business to make informed decisions and create more effective strategies, including marketing, customer acquisition and retention, inventory management, and more.
It usually involves integrating data from various sales channels and other sources, including ecommerce platforms, marketplaces like eBay (where understanding eBay taxes is crucial), and payment gateways – everything a business uses to sell their products and services, as well as receive and manage payments.
Operating with so much data might require something more actionable than a simple Excel file or a Google Sheet. And BI solutions are what businesses might leverage to ensure the overall success of the initiative.
Ecommerce business intelligence tool review
At this point, we’ll look at some business intelligence software that ecommerce businesses can use to analyze and visualize their business data and streamline their decision-making.
There’s a wide choice of BI tools available on the market, from the most simple to the most sophisticated, so basically, there are options to suit almost any business. Well, let’s get to it right away.
Synder Insights
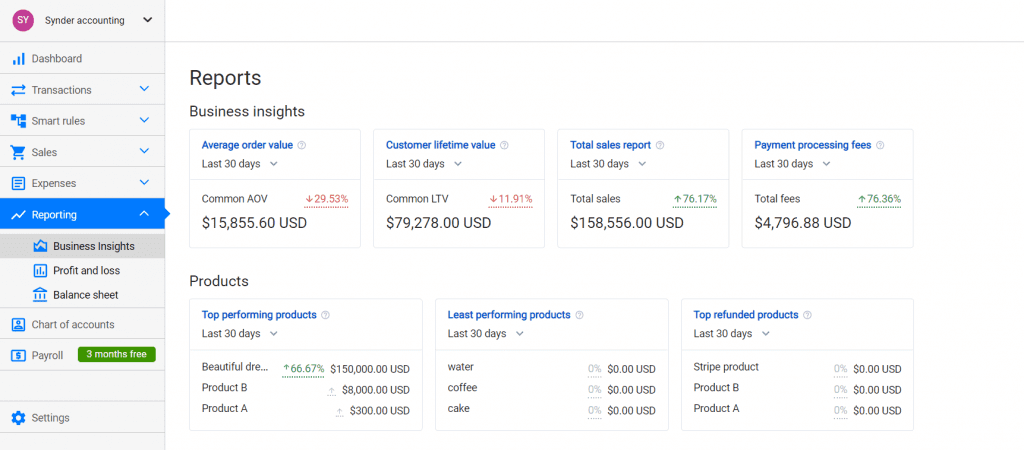
Synder is a cloud-based ecommerce accounting and analytics software that provides a 360-degree business overview through a business intelligence dashboard and a set of sales, products, and customer reports – Synder Insights. It connects with more than 25 different data sources, including ecommerce platforms, marketplaces, payment systems, and accounting solutions. Synder provides multiuser access, making it easier to share insights with everyone involved in decision-making.
What’s so cool about Synder for ecommerce businesses?
Synder is created for ecommerce businesses with a deep understanding of their needs. At the same time, it can perfectly suit other online product and service-based businesses with high transaction volumes. The platform is easy to use – connecting all the necessary data sources requires several minutes, and there’s always a possibility to add more anytime you need it. Some settings might need a little bit of a learning curve, but it compensates with a detailed knowledge base, robust knowledge management solutions, and a super cool support service.
Synder allows for analyzing past and current business data with the ability to sort it by sales channels, products, or customers to assess business performance from different dimensions. This way, it provides instant insights into sales, product performance, and customer behavior patterns that can dramatically impact strategic decisions.
If you want to learn more about Synder Insights’ key features, don’t hesitate to schedule a free webinar with the Support team or just give it a try and sign up for a free trial to see how it works in practice.
Tableau
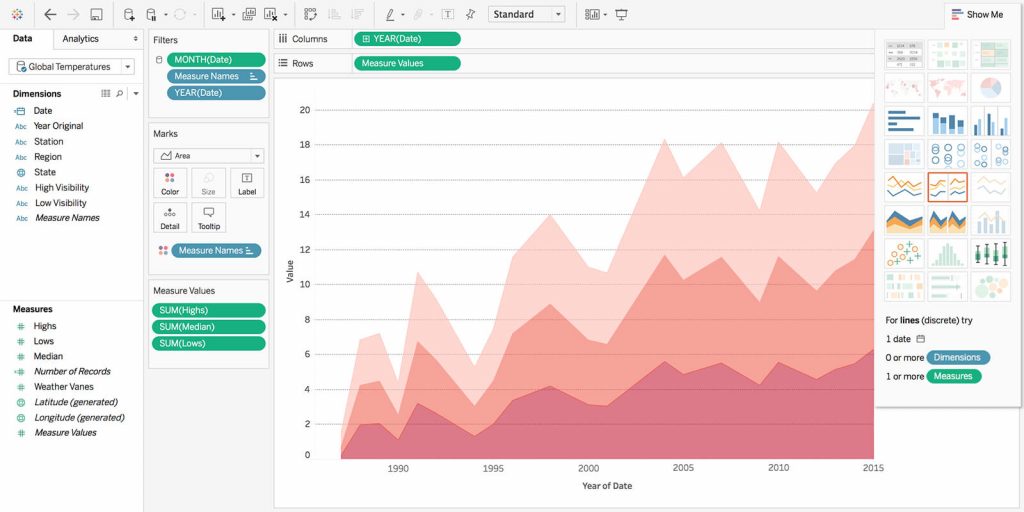
Tableau has been one of the most popular solutions in the BI tools market for more than ten years. Thanks to its great data visualization capability and comparatively easy implementation and use, Tableau holds a strong position among its competitors.
Source: Tableau
What’s cool about Tableau BI?
Tableau helps users visualize and analyze data from various sources and build the necessary reports and dashboards using simple drag-and-drop modules. It integrates with many business tools and databases, which makes it simple to implement into the existing business infrastructure.
Moreover, it features wide accessibility, offering desktop, mobile, and cloud versions compatible with most operating systems. One of the outstanding advantages of Tableau is its collaboration feature helping various teams to work together with reports for better decision-making. What makes Tableau great for users is that it doesn’t require deep programming knowledge to implement, so businesses might start working with it almost right upon installment.
Microsoft Power BI
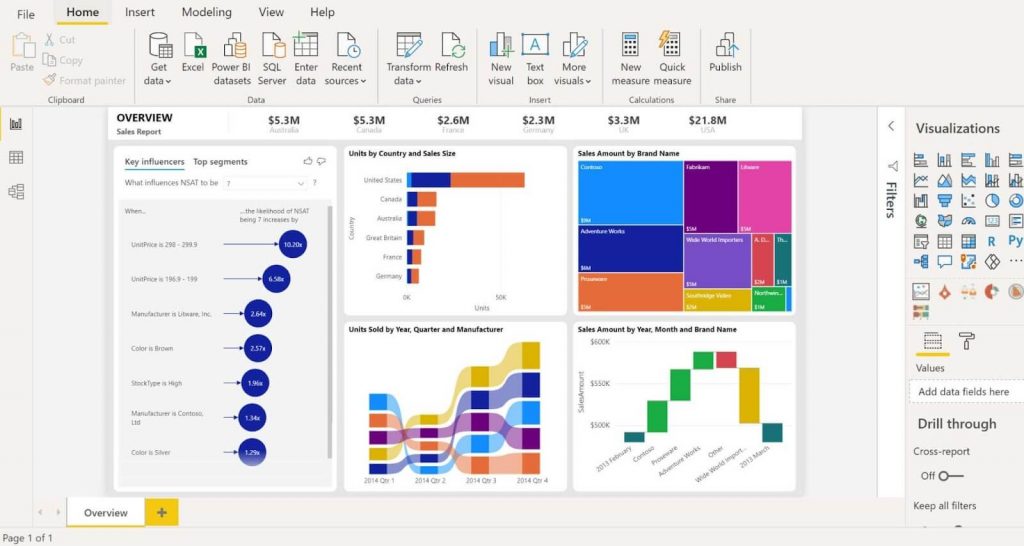
Microsoft Power BI is a cloud-based software accessible via the web or a mobile app and can be embedded into existing business infrastructure. A free desktop version is available, though its storage is limited, which makes it suitable for smaller businesses. If your business has bigger needs, you might want to switch to a paid cloud version and enjoy the full functionality as the business grows.
Source: Microsoft
What makes Microsoft Power BI so cool?
Power BI integrates with a wide range of pre-built dashboards and data sources, both cloud-based and on-premise, enabling users to consolidate large volumes of data and analyze it comparatively fast. The amount of possible visualizations it provides is immense, allowing for a comprehensive overview of business-critical KPIs and overall performance. Moreover, it allows for collaboration and interactive real-time reporting.
It needs to be mentioned that Power BI is more complicated to implement and operate than many other solutions on the market, even though it provides a vast knowledge base. And though the ability to quickly analyze large data sets and enjoy the variety of informative dashboards and reports pays off all the effort, you might want to consider this complication while planning the Power BI implementation and to experienced Power BI consultants for support.
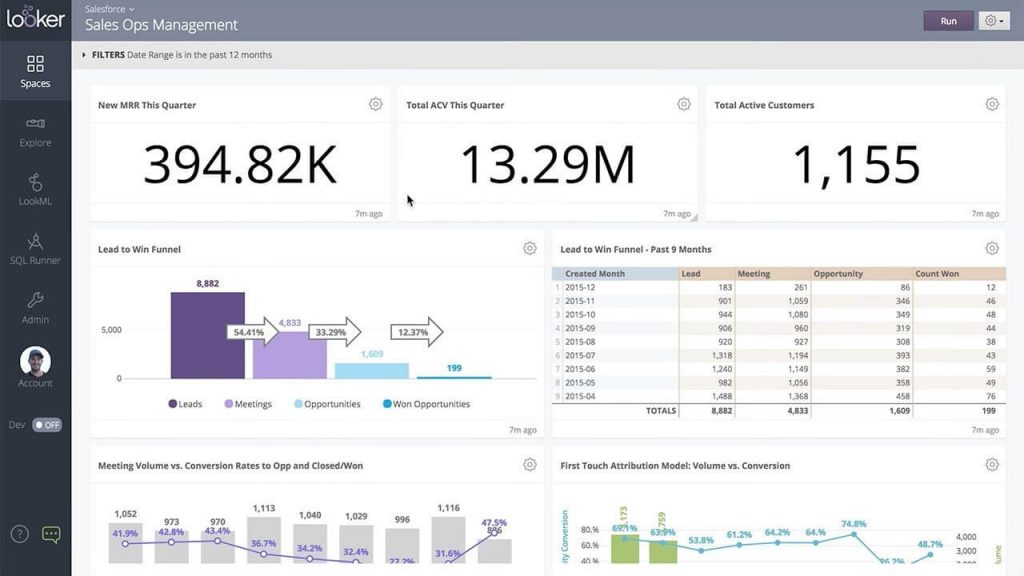
Looker Studio
Looker Studio – formerly Data Studio – is a powerful business intelligence software that helps companies of various sizes explore, analyze, and share real-time business insights. It’s a browser-based embedded BI tool that doesn’t require any installation and enables users to generate interactive and dynamic dashboards in a couple of clicks, schedule and automatically share reports, receive report alerts, and more.
Source: Looker
What’s cool about Looker Studio?
Looker Studio can smoothly work with a variety of popular databases and other cloud and on-premise-hosted data sources (if you’ve ever worked with Data Studio, you might remember the wide selection of data sources it comprised). Its own query language, LookML, drastically facilitates creating queries without any previous data analytics background. This way, users can create the dashboards they need from scratch if they can’t find anything covering their needs in the base of the pre-built tools. Add here the functions tailored specially for ecommerce businesses, and you can easily see why Looker Studio is so popular.
Sisense
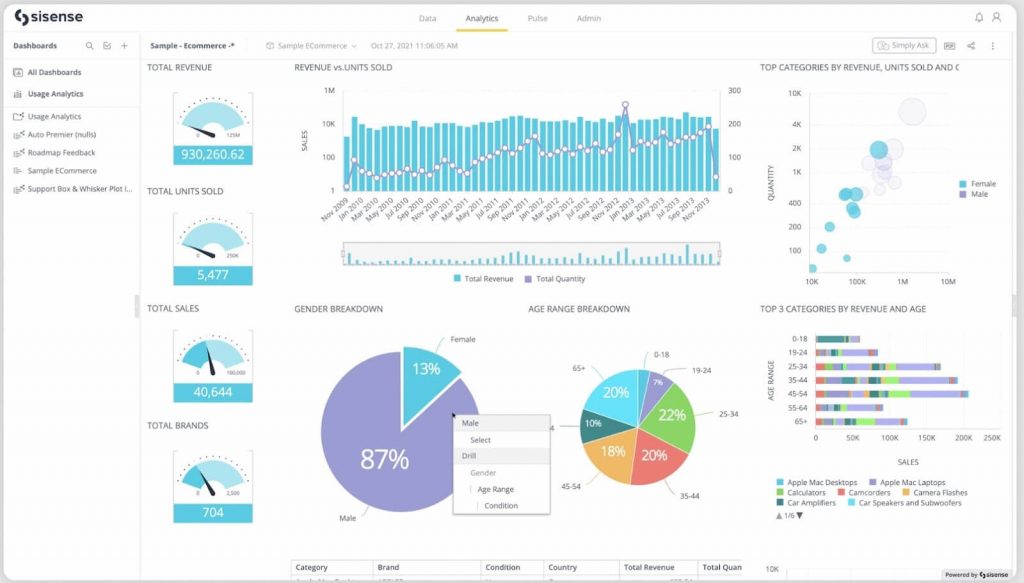
Sisense is an AI-based business intelligence software that simplifies complex data analysis and helps visualize business data, set and track KPIs, and provide insights for decision-makers. Sisense integrates with multiple data sources and allows various data mashups and data export in different formats (CSV, PDF, Excel, and more).
What’s cool about Sisense?
Sisense allows working with complex and high-volume data sets using a simple drag-and-drop functionality, which makes it suitable for non-tech-savvy users. It offers a wide selection of embeddable widgets, such as charts, gauges, graphs, and even dashboards, to use and share with everyone involved in decision-making. It also provides a capability to scale, so there’s no risk of having to switch to new software as the business grows.
Why do ecommerce businesses need business intelligence software?
While it may seem that BI is more applicable to big enterprises or the IT industry, understanding the nuances between revenue vs sales demonstrates that businesses of different sizes and sectors, including ecommerce, can also leverage BI effectively.
One of the key benefits of BI tools for ecommerce businesses is that it helps make sense of the data a company receives from all of the tools, platforms, and sales channels, opening a wide-angle lens into its performance, customers, and overall activity in real time.
Besides, there are a bunch of advantages that ecommerce businesses might find helpful and valuable: from improving operation and efficiency to reducing risks to gaining competitive advantages. Let’s break down some more virtues of using BI software.
Facilitated data-driven decision-making
A business intelligence tool helps accurately consolidate and analyze data from multiple sales platforms and payment gateways, giving a business a comprehensive overview of its most critical numbers and KPIs while making necessary calculations automatically. This way, the guesswork element is practically eliminated from decision-making. Moreover, it drastically decreases the time a company might need to test theories and elaborate more actionable strategies on sales and marketing activities, and more.
Improved data accessibility
The way a business uses data can greatly affect decision-making at different levels. At this point, BI tools help beat the silos by widening data accessibility across various parts of a company, dramatically improving collaboration. As a result, there’ll be no such things as departments that operate within their data bubbles with no access to critical information that might help implement more actionable strategies.
Ameliorated business processes and operation
Having a generalized view of your data and the ability to sort it by sales channels, customers, or products is key. This lets you compare these data sets against one another and give an ecommerce business invaluable insights into where exactly change, or more investigation, is required. For example, quickly identifying products that might go obsolete or learning which sales channel performs best or worst of all is crucial. At this point, a business owner can instantly see the problem and the possible range of solutions (like improving customer experience, working more on SEO, rethinking inventory practices, etc.). BI software is capable of highlighting such things and helping track the change.
More insight into customer behavior
Customers, being the source of an ecommerce business existence, always require a careful approach. The one who understands how customers behave, what makes them purchase, how often they buy, or when they’re ready to buy again, can stay on top of sales. At this point, customer data can be a secret weapon for an ecommerce business. It’s the BI tools that can turn it from a secret to a weapon by drilling into customer data and presenting it in an easy-to-get manner, visualizing trends and behavioral patterns that can help improve the marketing strategy and, consequently, increase sales.
Spotting problems and preventing risks on the go
The beauty of BI tools is that they help you track business data in real time, displaying changes as they occur. This type of software enables businesses to spot any unusual happenings – such as a rapid drop in sales, for example – on the go, timely investigate the case, and react accordingly.
Moreover, a business intelligence tool powers up business reporting with a high level of data accuracy and an overview of the data from a wider angle by consolidating otherwise siloed data sets. It can enormously help in detecting suspicious activity and fraud attempts. This way, a company can find the roots of fraudulent transactions faster and take measures to prevent their future occurrence.
Bottom line
As you can see, ecommerce businesses can dramatically profit from implementing business intelligence software into their management process. And sometimes, this implementation doesn’t require a sophisticated infrastructure or complex processes. Even the most simple business intelligence tools (combined with elaborated data policies regulating how data should be gathered and used across the company) can change the game.
Leveraging business analytics and BI for your ecommerce venture
To truly thrive in the ecommerce landscape, it’s crucial to marry business analytics with business intelligence. Here’s how to effectively blend the two together.
Data mastery
Start with the quality and source of your data. Accumulate information from varied outlets: your ecommerce platform, CRM, customer reviews, social media, and more. Once gathered, capitalize on BI tools to integrate and cleanse this data, ensuring it’s primed for detailed scrutiny.
Understand your past
Dive deep with descriptive analytics. By examining previous sales trends and comprehending customer behaviors, you lay the groundwork for future strategies. Identifying key customer cohorts during this phase is paramount.
Diagnose the present
With diagnostic analytics, decode the current challenges you face. Probe into the reasons behind cart abandonments or erratic sales patterns. Valuable insights often lie in feedback and reviews from your customers.
Foresee the future
Engage predictive analytics, a specialty of BI. Predictive models can offer projections, such as sales estimates for upcoming months or identifying potential bestselling products rooted in present trends.
Strategize actively
Invoke prescriptive analytics to form actionable strategies. Decisions ranging from product promotions, and optimal timings for sales, to trialing novel website designs can all be optimized with data-backed insights.
Visualization
Dashboards are more than aesthetic tools. Adopt them for a lucid, real-time depiction of essential metrics, enabling quick and informed decisions.
Continual evolution
Like in many elements of life, stagnation is detrimental to success. Continuously refine your strategies using fresh insights. Also, ensure your team’s proficiency in these tools and strategies through regular training.
In a nutshell
The synergy of business analytics and BI isn’t merely about crunching numbers. It’s about sculpting a dynamic, data-driven game plan in alignment with both your historical lessons and forward-looking aspirations for a holistic approach to business growth.
Final words: How to choose the right BI tool for your business
I’m pretty sure there’s no need to convince you that business intelligence is a must-have practice for ecommerce businesses that want to understand their performance and fine-tune it based on real numbers. However, provided there are so many different solutions on the market, it might not be obvious at first glance which would be the best option for a particular business.
To make the right choice, you might want to consider first of all, what kind of intelligence you want, whether it should be a daily real-time overview of the data or provide a deeper business analysis. Then, obviously, it’s how well a solution integrates with other business tools and data sources you already use (so that you won’t need to rebuild your whole business infrastructure). The ease of implementation might also matter, especially for smaller businesses that might not have specially trained staff. Reporting and visualization capabilities as well as available customization are a decision-making factor. Last but not least, you should consider scalability because as your business grows, your BI software needs to cope with the growing volumes of data to analyze.
Here’s to a future where every decision is powered by data!
Do you use a business intelligence tool or plan to implement it in your business? Share your thoughts in the comments, your opinion is very welcomed.




Interesting article Barbara, Really clarified the point of view for anyone running a e-commerce business.
Thank you so much, David! I also hope this article will be helpful to ecommerce businesses.