Break-even is an essential element of any organization’s financial planning framework as it helps in establishing how much revenue would be needed to offset total costs and thus incur more income than the cost of production. Analyzing the break-even point (BEP) for retail businesses helps in determining stock levels to ensure profitability. By using this analysis, retailers can make informed decisions to optimize pricing strategies, control costs, and improve overall profitability in a competitive market.
In this article, we’re going to discuss break-even analysis, the actual formula used to calculate it, and how beneficial it is for retailers to implement it. We’ll also point out variables that affect break-even points, errors to avoid, and guidelines for a successful retail business.
What is break-even analysis?
Break-even analysis is a practical method of reviewing the level of turnover and costs within a specific company because it recognizes the state when the company makes no profit, and there’s no loss as well. This point is known as the break-even point (BEP), which allows organizations to figure out how many more sales they require to break even.
Key terminology
- Break-even point: The sales level where profit is zero.
- Fixed costs: Costs that remain constant, like rent and salaries.
- Variable costs: Costs that fluctuate with sales, like inventory or packaging.
- Contribution margin: The main difference between sales revenue and variable costs per unit.
Grasping the basics of break-even analysis, including its terminology, gives a good base to using the tool. Why is break-even analysis very important for retailers? Let’s take a look.
Why retailers need break-even analysis
Break-even analysis is one of the ways used by retailers in pricing strategy, control of costs, and as a means of evaluating the level of profitability. It enables good financial decisions regarding resource mobilization for profitability for start-up companies or new product lines.
Picture a small retail store selling home décor items. To know whether it can pay for all the expenses and further make profit, the store does a break-even analysis to find its break-even point—the sales level where the profit is zero, meaning all costs are covered but no profit is made.
This store has fixed costs, such as rent and the salaries of employees, which are constant regardless of the number of items sold. It also faces variable costs like inventory costs for décor items and their packaging.
To reach profitability, the store looks at its contribution margin—the difference between the selling price per unit and the variable costs. It tells them how many units the store has to sell to cover both the fixed and variable costs.
By examining the break-even point, this retail store can strategically plan to cover all its fixed and variable costs. Knowing exactly how many units need to be sold to break even helps the store make well-informed decisions on pricing, inventory, and sales targets. To calculate this point, retailers use a simple yet powerful tool: the break-even formula.
The break-even formula
The formula for calculating the break-even point in units is:
Break-even point (Units) = Fixed Costs / (Selling Price per Unit − Variable Cost per Unit)
Note: The difference between the selling price and the variable cost per unit is known as the contribution margin per unit.
Example calculation
Let’s look again at our small retail store that sells home décor items. The store’s fixed monthly costs, including rent, utilities, and salaries, amount to $10,000. Each decor item has an additional variable cost of $20 for materials and production, and the store sells each item for $50.
To find the break-even point, the store can calculate how many items it needs to sell to cover both fixed and variable costs. Here’s how it works:
- Calculate contribution margin per item:
Selling price per item – variable cost per item = $50 – $20 = $30 - Determine break-even quantity:
Fixed costs / Contribution margin per item = $10,000 / $30 ≈ 333 items
Thus, the store must sell approximately 333 items per month to reach its break-even point, where it neither profits nor incurs a loss. Knowing this, the store can set realistic sales targets to start turning a profit.
Interpreting the break-even point
The break-even point shows the minimum sales needed to cover all costs. Any sales beyond this point contribute directly to profits.
Comparison with sales projections
Retailers can compare the break-even point with their sales forecasts to evaluate their business’s point. If projections fall short, they may need to adjust pricing or control costs.
Remember the break-even point for our retail store selling home décor? It’s about 333 units per month. If the projection shows expected sales of 300 per month, then there’s a possible shortfall. This will make the store management adjust their pricing strategies, perhaps offer bundles, or find ways to reduce costs of materials or operations to improve profitability.
Visual representation
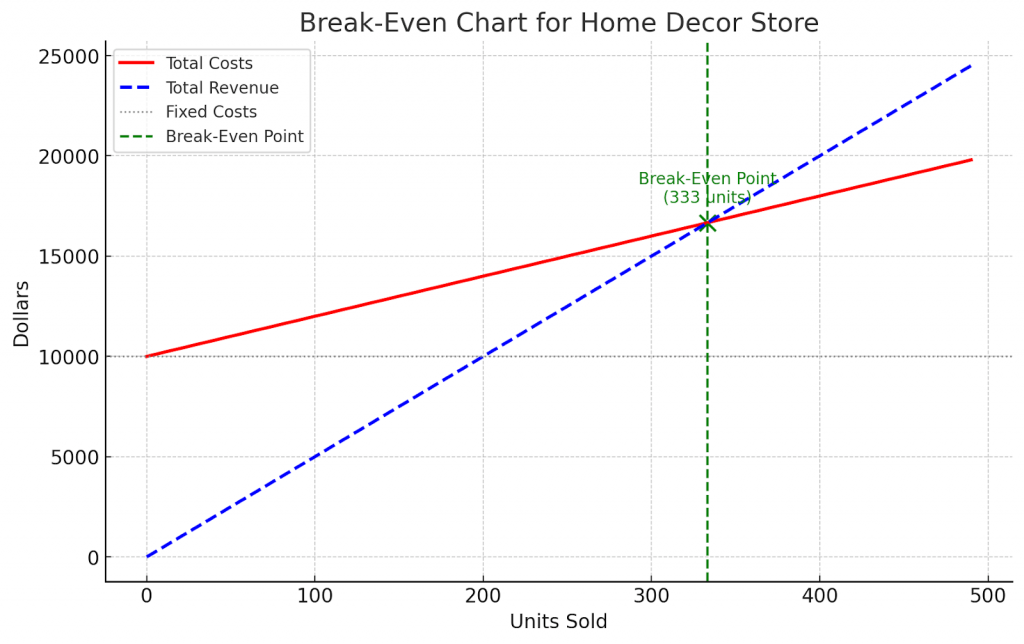
Graphs like a break-even chart help visualize how fixed costs, variable costs, and total sales interact. These visuals make it easier to communicate financial goals with stakeholders.
Here’s the break-even chart for our retail store:

How to read it:
X-axis: This axis shows the number of decorative items sold, giving a view of how sales volume changes the break-even point.
Y-axis (dollars): This shows the total revenue and costs in dollars.
Fixed costs line: A horizontal line represents fixed costs that remain the same, no matter what the volume of sales.
Total costs line: A line that begins from the fixed costs point on the Y-axis and slopes upwards to show that total costs rise as variable costs accumulate one unit at a time.
Revenue line: A line starting from the origin of the Y-axis, and with increasing value for each additional unit sold, showing the total revenue.
Break-even point: The point at which the total costs line intersects the revenue line, showing exactly how much in sales is needed for a store to pay all its costs and make zero profit.
Factors influencing the break-even point
Several key factors play a role in determining the break-even point, helping businesses understand how soon they can cover costs and start making a profit. Here’s a closer look at these factors:
Impact of fixed and variable costs
Changes in fixed or variable costs directly affect the break-even point. For example, if rent increases, more units must be sold to cover the higher expenses. Similarly, lowering variable costs per unit can reduce the break-even threshold.
Pricing strategies
Setting the right product price is crucial. Higher prices may lower the required sales volume to break even, but businesses must remain mindful of market positioning and customer expectations to avoid pricing themselves out of the market.
Sales volume fluctuations
Retailers often face seasonal demand or market shifts. For example, holiday sales spikes can help businesses reach the break-even point faster, while slower off-season periods require careful planning to maintain consistent cash flow.
Knowing your numbers
Accurate data on fixed costs, variable costs, pricing, and sales volume is essential for reliable break-even analysis. Keeping track of these numbers ensures that break-even projections are precise and useful for strategic planning.
Wondering how to stay on top of your sales numbers? Synder empowers retail businesses with real-time, accurate sales data by automatically consolidating transactions from multiple sales channels and payment platforms. With customizable reports and seamless accounting integration, Synder helps retailers track sales, costs, and profitability, enabling data-driven decisions for pricing, sales targets, and break-even analysis.
Test this powerful tool with a 15-day free trial or visit one of our Weekly Public Demos to learn how Synder can address your particular business needs.
Practical tips for retailers
Here’s how retailers can apply this tool to guide strategic planning and financial decisions:
Creating a business plan
Incorporating this analysis into a business plan ensures realistic goals and strategies. Knowing how much you must sell to cover costs helps define achievable milestones that guide everything from day-to-day operations to long-term growth initiatives.
Evaluating new products or services
When launching new products, break-even analysis helps assess their financial viability by estimating how long it will take to recover the investment. This is vital for deciding which products to bring to market and for managing risks associated with new offerings.
Financial management and planning
This analysis supports budgeting and forecasting by identifying cost savings or revenue improvement. Retailers can use it to manage inventory, control spending, and set realistic profit targets.
Common mistakes and misunderstandings
Break-even analysis is a great tool, but it’s easy to make mistakes that can lead to inaccurate insights. Here are some common errors to avoid:
Overlooking fixed vs. variable costs
Misclassifying costs is a common mistake that can skew the results of break-even analysis. It’s essential to correctly categorize expenses to avoid misleading conclusions.
Ignoring market conditions
Break-even analysis doesn’t exist in a vacuum. External factors such as economic trends, market competition, and consumer behavior can influence sales volume and pricing strategies, affecting the break-even point.
Failing to update calculations
Business environments are dynamic, and break-even calculations should be regularly revisited to reflect changes in costs, pricing, and sales trends. Routine updates ensure that break-even analysis remains relevant and reliable.
Wrap up
Break-even analysis may not be the most fascinating part of operating a retail business, but it’s a game-changer in understanding precisely what you need to keep the lights on. Knowing your break-even point provides a roadmap for setting prices, controlling costs, and making sure all those hard-earned sales are actually paying off.
With Synder in your toolkit, you’ll have that little extra help along the way to ensure all your numbers are in one place and you’re on track. Have instant access to the right sales data and profitability insights—including those hard-to-come-by “right numbers”—minus the headaches. So you can stay focused on what you do best: serving your customers and growing your business.


Thanks for the article! This break even analysis provided me with some tips for my own UK accountants business, Nacstaccs.
Thanks for your comment!