
- Graph 1: Transaction Volume by Platform
- Graph 2: Sync Time Process Breakdown
- How to Estimate the Time Needed to Sync 100,000 Transactions
- FAQ
Sync speed reflects how long it takes Synder to process one transaction.
However, it’s important to understand that the number of transactions you see in reports may not match what you are billed for. Synder does not charge for certain transaction types (such as fees, fee refunds), so reported volumes are often higher than billed usage.
For Summary users, billing is based on grouped transactions (summaries), and the timing of when a summary is synced can significantly affect how it compares to the data shown in graphs.
Use this if:
- You want to estimate how long syncing large volumes will take
- You want to understand why your sync is slow
- You want to analyze performance across platforms
Don’t use this if:
- You need help connecting platforms or starting a sync
- You want to speed up transaction synchronization time (check how to speed up syncs in the Speeding Up Syncs guide)
- If you are using QuickBooks Desktop. Sync speed tracking is not available for the accounting integration. The Sync Speed tab will not appear in the dashboard for connected QuickBooks Desktop platforms.
Graph 1: Transaction Volume by Platform
What this graph shows
This graph displays the total number of transactions synced for each platform during the selected time period.
You can access this graph from the Synder Dashboard located on the left side bar
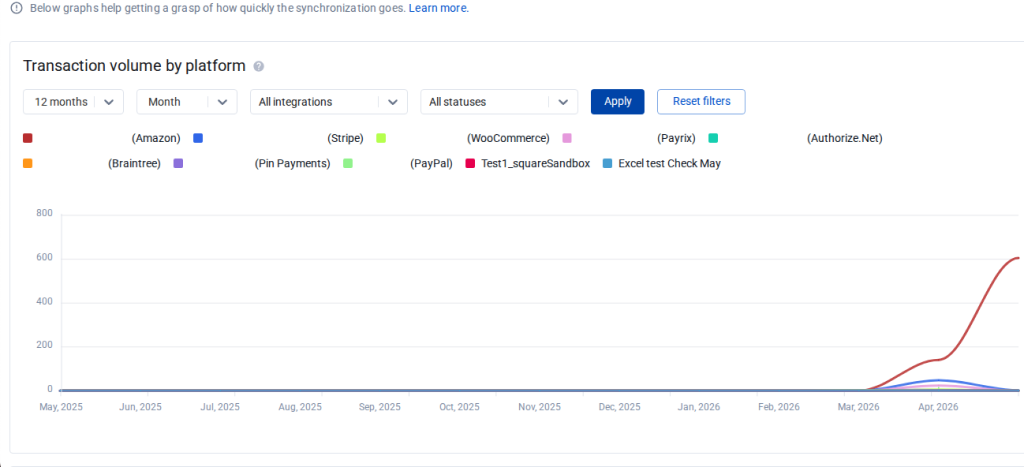
What you can use it for
Use this graph to:
- Understand the syncing volume for each integration by day or month
- Estimate your current syncing load across platforms
- Use transaction volume as a reference point when projecting remaining sync time
Notes
Keep the following in mind when reviewing this graph:
- For summary syncs, the graph shows the number of individual transactions added to the Synder Data Source. Your summaries are then created based on those transactions.
- Today is excluded. The current day’s data is not yet aggregated into the charts. The latest data point you see represents yesterday’s final tally.
- Weeks start on Monday. Weekly buckets are aggregated Monday through Sunday, regardless of the week-start preference in your accounting platform.
- No data will appear unless at least one sync has already been performed.
- Report data is available from May 2026 onward, when the Sync Speed dashboard was released. Older sync history is not represented in these graphs.
Graph 2: Sync Time Process Breakdown
This graph displays the average sync processing time, based only on completed transaction syncs.
It reflects the time spent actively processing the sync and does not include queue wait time.
This graph can be accessed from the Dashboard Page.
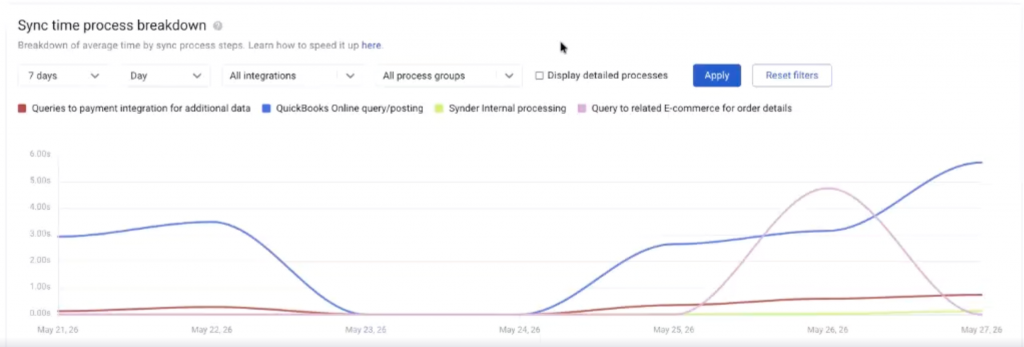
Use this graph better to understand sync performance across platforms and process stages. For example, it can help you:
- Compare how long it takes to sync a transaction for each platform, such as Shopify or Stripe
- See how much time is spent in each process group
- Drill down into the time spent in each specific process
Understanding process groups
Process groups provide a high-level view of where sync time is being spent during the overall workflow.
They help break the sync into major stages, such as:
- Retrieving data from the integration
- Processing data inside Synder
- Posting data to your accounting platform
This makes it easier to identify which part of the sync is taking the most time. You can learn more about process groups here.
Best practice
For the most accurate analysis, we recommend reviewing each provider separately. This gives you a clearer picture of sync behavior and timing for a specific platform.
How to Estimate the Time Needed to Sync 100,000 Transactions
To estimate how long your sync will take, start by checking how many transactions Synder can process per day in your account.
How to estimate it
- Open the report
- Identify the days with the highest processing volume
These are usually the days when you sync a large amount of historical data. - Use that peak daily capacity to estimate your total sync time
Divide the number of transactions you need to sync by the highest number of transactions Synder processed in a day.
Example
Let’s say your report shows that during regular daily syncing, Synder processes around 1,000 transactions per day. That reflects normal usage, but not your maximum syncing capacity.
Then you find a historical sync day where Synder processed 45,000 transactions in one day.
Based on that number, if you need to sync 100,000 transactions, the estimated sync time would be about 2 to 2.5 days.
Actual sync time varies significantly based on your connected platforms, transaction complexity, queue load, and plan tier. Use your own historical peaks for a more accurate estimate.
FAQ
Why not just multiply the average sync time by the number of transactions?
You can do that, but it only gives you the minimum possible processing time.
That is because the total waiting time is made up of two parts:
Total waiting time = sync time + queue time + untracked time
- Sync time — the active processing duration once Synder picks up a transaction for syncing. This is what the Sync time process breakdown graph shows.
- Queue time — the time a transaction waits in the sync queue before processing begins. This includes time spent behind other syncs in your own organization and behind syncs from other organizations sharing the same worker.
- Untracked time — small amounts of overhead between processing stages that are not individually measured.
The average sync time only reflects the actual processing time. It does not include time spent waiting in the queue alongside other Synder users’ transactions, or the time it takes between sync stages
Important note about queues
Customers on the Small Enterprise and Premium plans are processed on a separate worker environment, which significantly reduces queue time compared to the standard shared queue. Queue time can still occur if multiple premium customers are syncing concurrently, but it is meaningfully shorter than the general queue.
If you want to learn more, you can check the pricing page to see whether that plan is the right fit for you.
Reach out to Synder Team via online support chat or email with any questions you have – we are always happy to help you!