The financial world of any business revolves around accounting – a complex system of recording and summarizing financial transactions, as well as analyzing, verifying and presenting the results in the form of various reports.
Today we’d like to focus on two pillars of financial reporting – the profit and loss (P&L) statement and the balance sheet, and explain what these reports are, how to calculate them and why they matter.
What is financial reporting?
Financial reporting refers to an accounting practice that creates financial statements in order to disclose information about the finances and performance of a business over a particular period of time. Basically, financial reporting allows business owners and stakeholders to understand how much money they have, recognize where this money comes from, and identify how this money should be spent.
Why is financial reporting important?
Reporting is an essential part of business, regardless of its size. Reports tell the financial story of a company – how successful or unsuccessful it is, and how likely it is to receive an investment or help.
There are multiple reasons why business owners should take these analytical tools seriously. Accurate reporting allows them to:
- Evaluate the financial health of a business: Knowing where your business is helps you make informed decisions about investments, sales, and purchases, as well as use it to attract potential investors and keep the existing ones happy.
- Keep track of business transactions: When you know exactly what you own and owe and are due to receive, planning for the future isn’t that daunting.
- Forecast: While numbers may fluctuate, thanks to analysis and comparison, you’re able to project revenue and predict cash flow.
- Build a sustainable budget: Your budget must cover everything while still ensuring profitability. Reports give you the data that should prevent you from mismanagement.
- Stay compliant: Most of the reports are shared with tax authorities who ensure that a business operates in accordance with law and tax regulations.
Financial reporting focuses on the creation of general-purpose financial statements that are typically made publicly available, two of the most important ones being the P&L and the balance sheet.
P&L: what it is and how to calculate it
Profit & loss, or also known as the income statement is a summary of revenues, costs and expenses incurred by a business over an accounting period, usually a quarter or a year. P&L is used to determine whether a business in question is able to generate profit if they increase revenue, decrease costs, or both.
There’s no universal template for this type of report, but it typically includes revenue, expenses, earnings, and net income. Periods for comparison may vary in order to trace changes and trends as well as identify areas of the business that could be more profitable or deserve less attention.
To calculate P&L manually, a business usually goes through the following steps:
- Determining operating revenue – total income a business has received for selling products or services;
- Calculating net and gross revenues, which include accounting for total sales revenue and revenue remaining after subtracting costs;
- Estimating non-operating revenue a business has received from investment interest, dividends, royalty payments, etc.
- Calculating primary or operating expenses – all the general and administrative costs accrued from running a business, including cost of goods sold (COGS), depreciation and selling;
- Calculating secondary expenses which typically include debt or loan interest, and asset and capital losses.
📌 Need more info on P&L? Check out our article Profit and Loss Statement (P&L): A Beginner’s Guide and how it can be detailed through a multi-step income statement approach
P&L with Synder
If you’re not keen on calculating your P&L yourself, Synder is here to help. The financial reporting tool gathers all your income and expense transactions (invoices, sales receipts, bills, checks, etc.) and posts them into this report. No manual calculations or worries involved. But let’s see how the magic happens.
With Synder, you can prepare P&L statements for various periods: current month to date, previous month, current year to date, or a custom interval (last ten days, for example). Just set the period and review the result.
You may also choose the way the columns in the statement are going to be displayed – by location, contact, e-commerce store, product, tags, tax, payment processor.
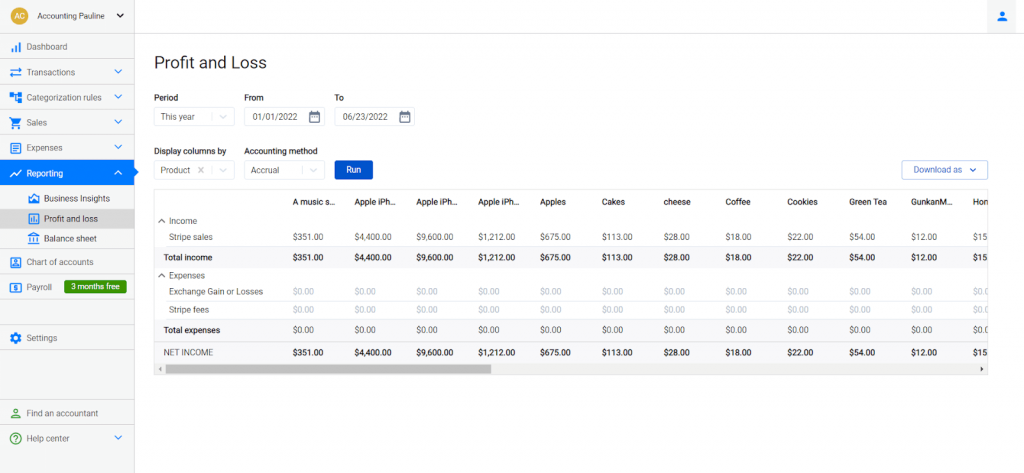
The filters allow you to get the most detailed information about which client, product, class, and payment platform is more profitable and which aspects of your business need extra attention.
Once you’ve chosen your filters, Synder’s ready to calculate your P&L statement and in order to do that the software automatically goes through the following steps:
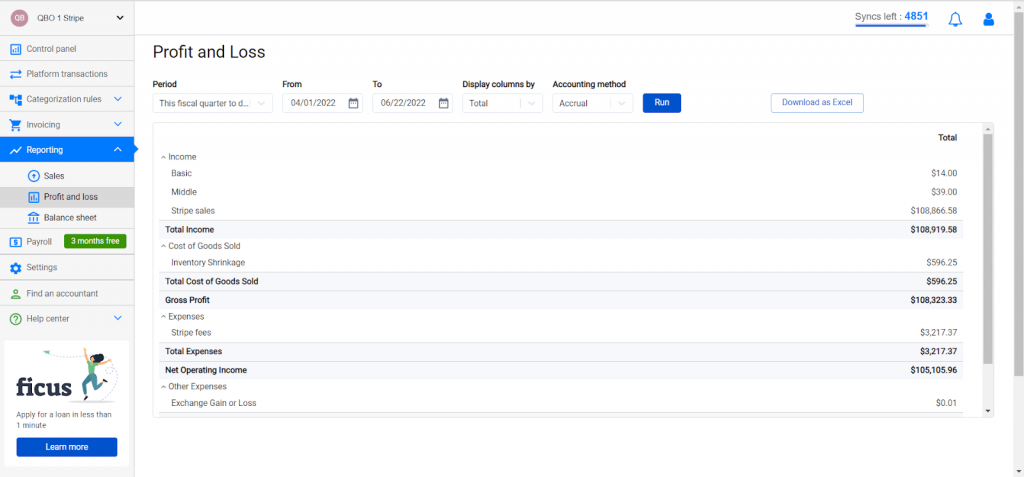
1. Calculating operating revenue or total income. The system totals everything you’ve earned over the accounting period, gives you your total operating revenue and displays the number under the ‘Total Income’.
2. Calculating cost of goods sold (COGS). The software sums up all expenses associated with manufacturing, selling, and shipping a product and puts them under ‘Total Cost of Goods Sold’.
3. Determining gross profit. Synder subtracts COGS from your total income to determine your gross profit – the amount of money you’ve earned from selling your goods and services.
4. Calculating operating expenses. All of your operating expenses (the costs spent on running your business – administrative, general or selling) are summed up and the total number is labeled as ‘Total Expenses’.
5. Obtaining net operating income. To get the net operating income, the system subtracts the operating expenses from your gross profit. The number is labeled as ‘Net Operating Income’ on the statement.
6. Calculating other expenses. Here Synder adjusts for any additional income or expenses not related to the primary activities of your business. Interest, dividends from investments, taxes, depreciation and amortization expenses, etc. are summed up and the total is displayed under ‘Total Other Expenses’.
7. Obtaining net income. Synder determines the net profit of your business by subtracting the total expenses from your gross profit. Your net profit is labeled as ‘Net Income’.
Now your ideal profit and loss statement is ready and you’re ready to share and interpret it. So many steps – so little human involvement!
Balance sheet: what it is and how to calculate it
A Balance sheet is a snapshot of a company’s financial position as of a specific date. It assesses and demonstrates the liquidity of a given business as it contains information about how much it owns and owes, along with how much is invested by shareholders, as well as debt coverage.
The report has 3 main components: assets, liabilities, and shareholders’ equity. These three elements together give you a complete picture of the financial health of your business and allow you to evaluate the effectiveness of your financial strategies, rationality of your spendings, and ability to pay debts.
Most often businesses choose to track balance sheets quarterly and go through the following steps while calculating them:
- Accounting for assets – everything a business owns that can be turned into cash.
- Estimating current liabilities – everything a business owes. Here we calculate debt, accounts payable (AP), wages and dividends a business has to pay, tax expenses, etc.
- Calculating equity – the value of ownership. It includes both shareholder and owner equity values, for example share capital, retained earnings, net income and dividends, etc.
A balance sheet shows the total assets of a business, minus the equity it currently possesses and liabilities.
📌Need more info on the balance sheet? Check out our article What is a balance sheet from a business owner’s perspective?
Balance sheet with Synder
Synder does the work of creating an impeccable balance sheet in a split second while you’re devoting your resources to other things that matter to your business.
Just like with the P&L, you’re able to filter and display the columns by period and accounting method, allowing for more flexibility and attention to detail.
The system AUTOMATICALLY calculates your balance sheet by:
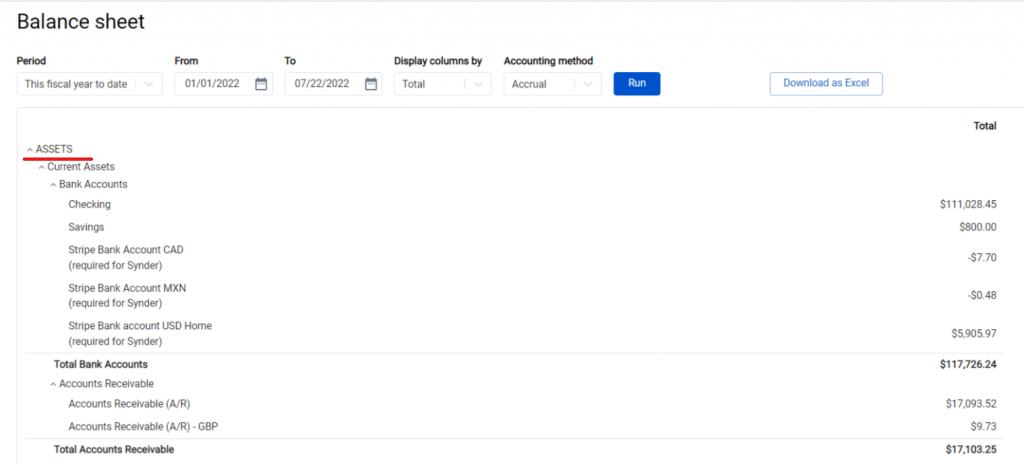
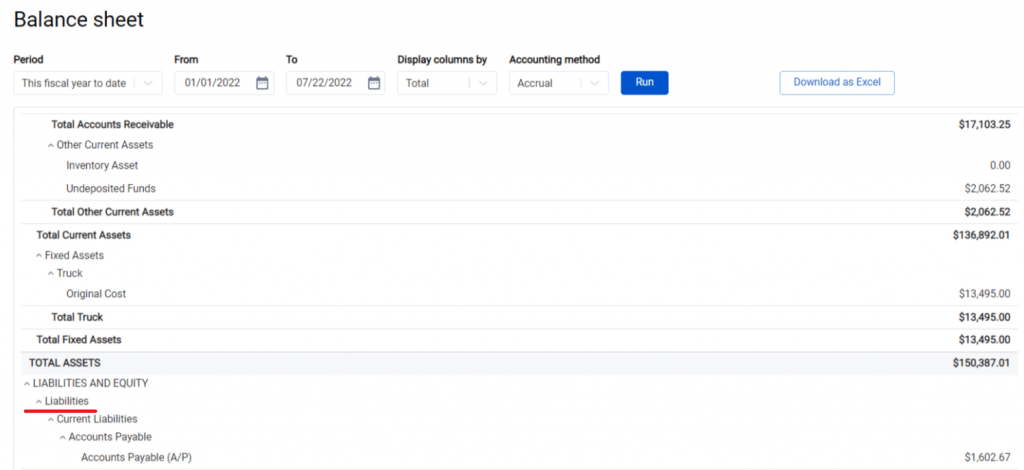
1. Evaluating the assets your business owns. This step includes accounting for current or liquid assets (bank accounts, accounts receivable (AR), inventory), and fixed or long-term assets (equipment, machinery, property, buildings, etc.). The assets are summed up by category (‘Total Bank Accounts’, ‘Total Accounts Receivable’, etc.) and then totalled under ‘Total Assets’. This way you can clearly see how much each category is worth in particular but at the same time know the aggregate number.
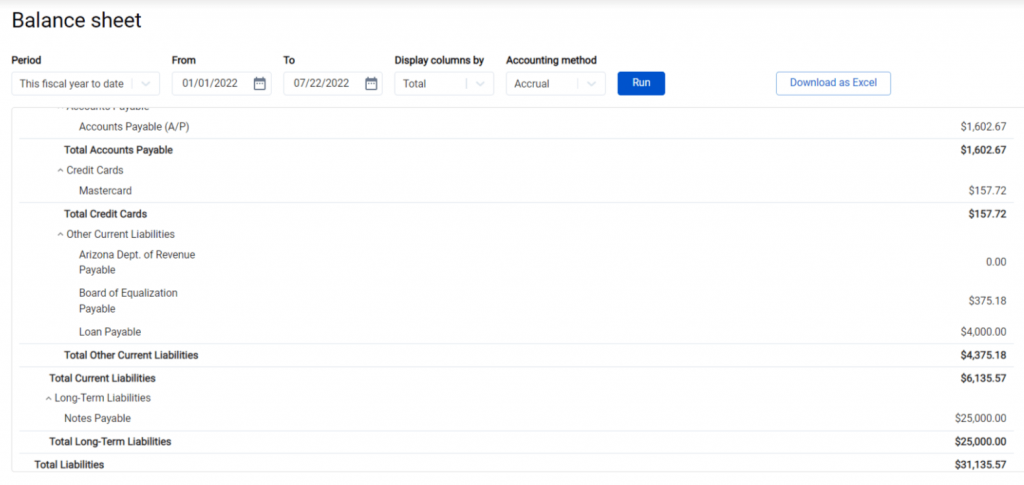
2. Calculating liabilities. Synder shows two categories of liabilities – ‘Long-term liabilities’ (notes payable) and ‘Current Liabilities’ (utilities, rent, accounts payable (AP), taxes, etc.). The total amount of liabilities is displayed under ‘Total Liabilities’.
3. Calculating equity. The system determines the retained earnings and net income of your business and labels them appropriately, then calculates total equity by subtracting total liabilities from total assets (the amount can be found under ‘Total Equity’).
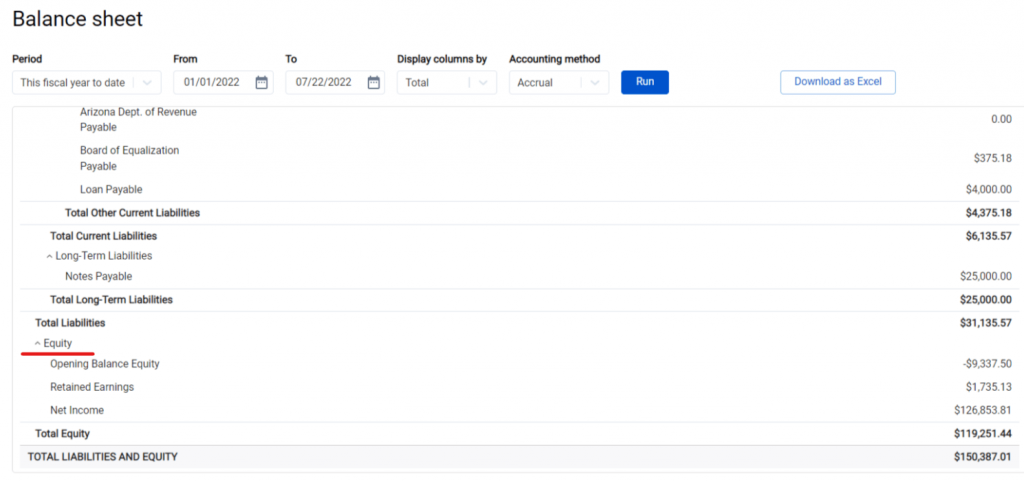
4. Checking the results. Synder determines the total liabilities and equity number which should equal the assets of your business. The number is labeled as ‘Total Liabilities and Assets’.
Now your flawless balance sheet is ready!
Why Synder?
Synder is a comprehensive, easy-to-use, all-in-one e-commerce accounting solution that automates a significant part of your accounting and helps you get rid of mundane manual work. Once it’s set up correctly, not only does it capture and categorize detailed data from all your connected platforms, and facilitates reconciliation, but it also creates flawless reports in just a few clicks.
Synder’s reporting feature allows you to create accurate P&L statements and balance sheets anytime and anywhere applying various filters. Why waste your or your CPA’s resources on something that can be done in the background? Schedule a demo with our specialists to check out Synder’s reporting and other features, or try it yourself by starting a 7-day free trial! Let Synder do the hard work for you, trust the automation!