In today’s dynamic business landscape, knowing where your company stands financially isn’t just a benefit — it’s a necessity. And one of the most crucial aspects to assess is profitability.
After all, understanding your company’s financial health is about more than just counting the cash in the bank — it’s about making strategic decisions that contribute to your overall business performance, growth, and sustainability.
In this guide, we’ll explore profitability analysis: what it is, why it’s essential, how to conduct one, and the roles of margin and profit ratios in the process. We’ll also share some of the most effective practices for conducting a profitability analysis, helping you make the most of your business’s financial data.
So, buckle up as we dive deep into the world of profitability analysis — a crucial tool for anyone serious about taking their business to the next level.
Contents:
1. What is profitability analysis and does it solely focus on profit itself?
2. Why is profitability analysis important for a company and its financial well-being?
3. What are the methods of conducting profitability analysis?
5. What are some of the most successful practices for profitability analysis?
What is profitability analysis and does it solely focus on profit itself?
Profitability analysis is the process of examining the ability of a business to produce a profit.
Such an analysis is something that internal managers should conduct of their own business. It’s also something those interested in purchasing or investing in another company may want to undertake, as this type of analysis can help level the playing field and make different companies’ financial statements easier to compare.
While keeping a constant eye on the bottom line — net income (i.e., profit) — on a company’s financial statements is helpful, a profitability analysis goes more in-depth than this.
Why is profitability analysis important for a company and its financial well-being?
Profitability analysis is essential for all businesses as it monitors the essential goal of all companies — maximizing profit for shareholders. Whether there’s just one shareholder or many, profitability analysis helps business decision-makers understand which product lines are most successful, where cost controls need to be implemented, and where expansion dollars should be directed. Leaders can also monitor different divisions in the company, for example, to monitor if B2C efforts outpace or underperform the B2B business.
Once areas for improvement have been identified and changes implemented, trends highlighted by a profitability analysis can monitor the effect of the said changes and provide feedback on whether the changes were enough to expand profit margins.
What are the methods of conducting profitability analysis?
At its most basic level, such an analysis is performed by reviewing the Profit and Loss Statement (P&L) to see if revenue is greater than or less than expenses. The bottom number on the P&L, Net Income or Loss, tells you if any money was left over after your earnings were used to pay your expenses. A positive number means that profit exists, while a negative figure indicates that costs surpassed revenue levels for the given period.
New users of financial statements should be mindful that profit doesn’t equal a cash balance. Not all transactions are reflected on a P&L, such as, but not limited to, the principal portion of debt payments, asset purchases, and distributions.
Depending on how your accounting records are organized, more in-depth analysis can be conducted, zeroing in on specific revenue streams and their related costs. If you’re using QuickBooks Online, create unique Products and Services for each item you sell, and then you can run a Sales By Product/Service Report to drill down into your revenue data and analyze revenue by stream instead of as a whole. It’s also recommended to match expenses as closely to your income as possible. For a service business, this might require allocating wages or software platforms used into division or revenue-specific cost accounts.
Once all your data is properly organized, you can take profitability analysis to the next level using financial ratios.
What are the margin ratios in profitability analysis and why are they important for better understanding your profit?
Ratios are just one metric that enables gaining insight into a company’s performance by evaluating the relationship between two or more financial statement line items. Ratios are best viewed over time so that trends can be seen. In this way, they allow business owners to monitor performance and offer investors a means to compare companies within an industry.
There are five main groups of ratios. Each group offers several ratios one can calculate depending on the specific financial question being studied. Profitability Ratios are one such group.
Profitability Ratios help evaluate a company’s ability to generate earnings relative to its income. Generally, higher ratios, or ratios increasing in value over time, indicate the presence of some comparative advantage that has allowed a company to trim costs or sell at higher price points.
Our consultancy’s favorite Profitability Ratios are the Gross Profit Margin Ratio and the Net Profit Margin Ratio.
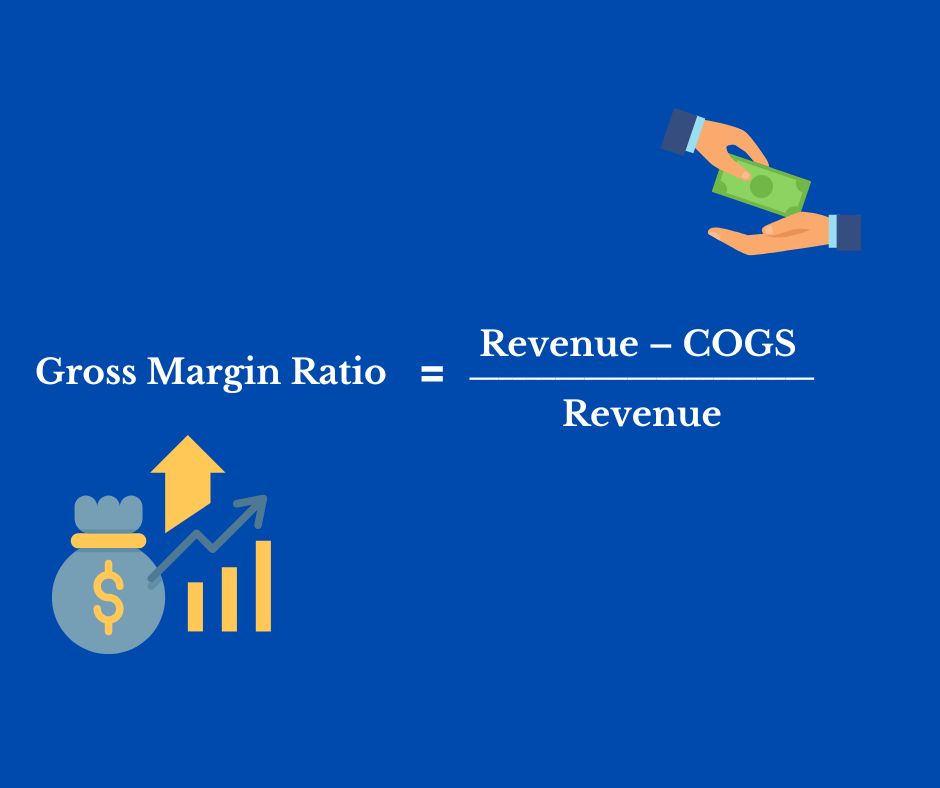
Assuming your Chart of Accounts is appropriately structured, the Gross Profit Margin Ratio can be easily found in most accounting software by turning on the Percent of Income feature. If this isn’t available to you, the Gross Profit Margin Ratio is one of the easiest to calculate manually:
Gross Margin Ratio = (Revenue – Cost of Goods Sold) / Revenue

The higher this ratio, the better your overall performance is. If your Gross Margin Ratio is, for example, 0.3, or 30%, that implies that for every dollar you earn, $0.70 goes towards direct costs. At the same time, $0.30 is available for Selling, General, and Administrative Expenses, and ultimately, net profit. This ratio can be improved by increasing your sale prices or lowering the costs of labor or inventory.
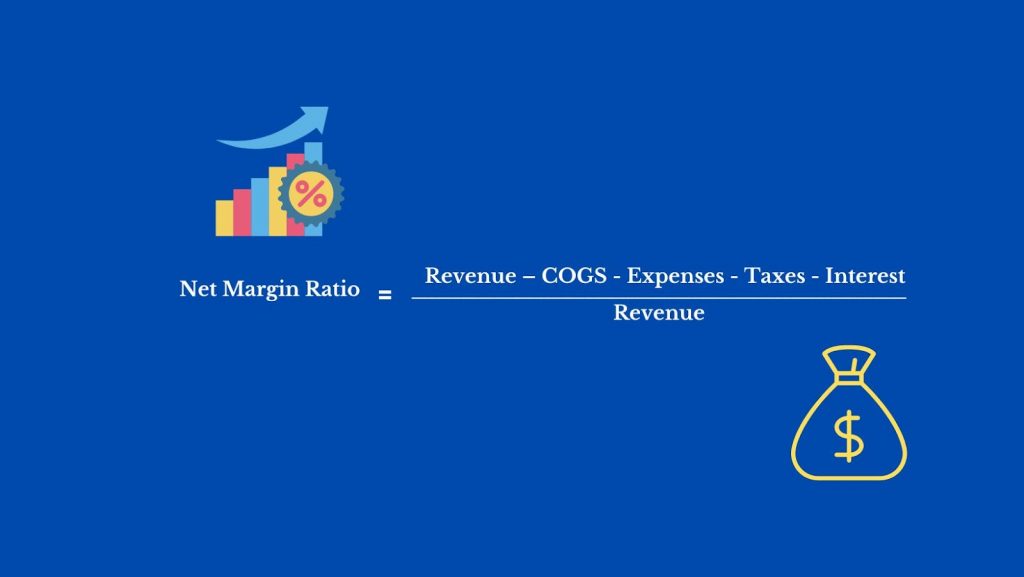
Our second favorite Profitability Ratio, Net Profit Margin, expands on the above by considering all expenses. The formula is the same as the Gross Profit Margin Ratio, except that instead of subtracting Cost of Goods Sold from Revenue, you deduct it, plus all operating and overhead expenses, interest, and taxes.
Net Profit Margin Ratio = (Revenue – Cost of Goods Sold – Expenses – Interest – Taxes) / Revenue

While this formula may pull in some one-off transactions, it’s still a valuable ratio for financial leaders to monitor and easy for the layperson to calculate.
What are some of the most successful practices for profitability analysis?
We recommend that businesses monitor their gross profit monthly and compare it to an internal goal or benchmark standard that will vary by industry. Before trusting and making decisions based on this number or ratio, ensure all bookkeeping is accurately done, and all cash accounts are reconciled to the end of the period. Failing to do this could leave duplicate transactions in your books or some data missing, which can significantly swing the ratio and mislead you.
We also recommend not taking any ratio in isolation, especially the Net Profit Margin, which can often include significant dollar amount transactions that won’t reoccur. Therefore, it’s best to review this number over time. Even if you’ve never looked at data this way, with accounting software or Excel, you can easily and quickly calculate these figures for historical data.
Finally, we advise that you have a Cost of Goods Sold section on your P&L Statement. Many service businesses don’t set this up, thinking there can’t be any Cost of Goods Sold if they aren’t selling physical goods. Consider the P&L section labeled Cost of Goods Sold more broadly to include any direct cost. It can be renamed Cost of Revenue or Services. These are any costs that are direct producers of your income. At a basic level, this will consist of the wages and payroll taxes for any direct labor staff.
Conducting analysis of your company’s profitability: The secret to securing financial stability & more profit
Profitability analysis is more than just a tool — it’s an essential compass guiding your business toward a prosperous future. By analyzing profitability, businesses can identify and capitalize on their most profitable products or services, optimize costs, and strategically plan for expansion.
Using key ratios such as the Gross Profit Margin and Net Profit Margin allows a more granular understanding of the financial health of the organization, enabling businesses to make informed decisions. However, remember that viewing these numbers in context and as part of an ongoing trend rather than as standalone figures is essential.
Through rigorous and consistent profitability analysis, businesses can gain a competitive edge, enhance their financial health, and set themselves up for long-term success.


