
The world of finance and investment is rife with ratios and metrics, each designed to provide a unique perspective on a company’s financial health and performance. Among these, the asset turnover ratio stands out as a critical tool for investors and analysts alike.
In this article, we will look at the concept of the asset turnover ratio, its calculation, and significance in evaluating a company’s operational efficiency and profitability.
Understanding asset turnover
At its core, asset turnover is a measure of a company’s efficiency in generating sales revenue from its assets. In other words, it quantifies how well a company is using its assets to drive core business operations.
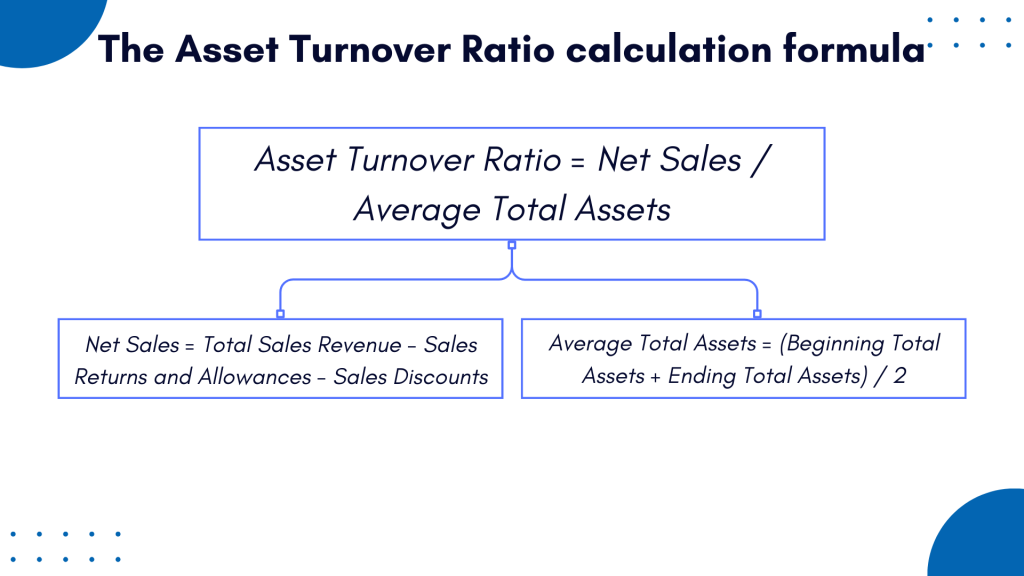
To calculate the asset turnover ratio, we use the following formula:
Asset Turnover Ratio = Net Sales / Average Total Assets
Let’s break it down.
What are net sales?
Net sales, also known as revenue or total revenue, is a financial metric that represents the total amount of money generated by a company from its primary operations, typically from the sale of goods or services. It is a crucial indicator of a company’s top-line performance and is often used to assess the company’s overall financial health.
The formula to calculate net sales is:
Net Sales = Total Sales Revenue – Sales Returns and Allowances – Sales Discounts
Here’s a brief explanation of each component:
- Total Sales Revenue
This is the total amount of money a company earns from selling its products or services during a specific period, typically a month, quarter, or year. - Sales Returns and Allowances
Sometimes, customers may return products or request allowances (discounts) due to product defects or dissatisfaction. This figure represents the total value of such returns and allowances. - Sales Discounts
Companies may offer discounts to customers to encourage early payment or bulk purchases. Sales discounts represent the total value of these discounts given to customers.
By subtracting sales returns and allowances as well as sales discounts from the total sales revenue, you arrive at the net sales figure, which provides a more accurate representation of a company’s revenue after accounting for these adjustments. Net sales are often reported on a company’s income statement as a key financial metric.
Now let’s look at average total assets
Average total assetsis a financial metric that calculates the average value of a company’s total assets over a specific period, typically a year. It provides insights into how effectively a company is managing its resources to support its operations.
The formula to calculate average total assets is:
Average Total Assets = (Beginning Total Assets + Ending Total Assets) / 2
Where:
- Beginning Total Assets are the total assets of the company at the start of the accounting period.
- Ending Total Assets are the total assets of the company at the end of the accounting period.
By averaging the total assets at the beginning and end of the period, you get a representative figure for the assets the company had available during that time. This average is often used in various financial ratios and analyses to evaluate a company’s performance and efficiency in using its assets to generate returns.
Differentiating asset turnover and turnover rate
Before we dive deeper into the asset turnover ratio, it’s important to distinguish it from the turnover rate, a term that is often used interchangeably but carries a totally different meaning. As both are important business metrics, a business owner needs to understand them to avoid confusing the terms and make better sense of various company numbers . At this point, we’ll look at these metrics in more detail.
Asset turnover ratio
As mentioned , the asset turnover ratio is a critical financial metric used by businesses and investors to assess how efficiently a company utilizes its assets to generate revenue. It quantifies the company’s ability to maximize its resources and convert them into sales or income.
In essence, this ratio tells us how many dollars in revenue a company generates for each dollar of assets it holds. A higher asset turnover ratio indicates that the company is effectively using its assets to generate income, while a lower ratio suggests inefficiency in asset utilization.
Turnover rate
The turnover rate is a whole different story as it pertains to a different aspect of a company’s operations. This rate quantifies the frequency at which employees leave a company and are replaced, typically over a specific time frame, such as a year. It’s an essential metric for human resources and management to gauge workforce stability and employee satisfaction.
A high turnover rate can indicate various issues within an organization, such as low employee morale, inadequate compensation, or poor working conditions. It can result in increased recruitment and training costs and a loss of institutional knowledge. On the other hand, a low turnover rate generally reflects a more stable and contented workforce, which can lead to improved productivity and long-term business success.
The role of assets in asset turnover ratios
Assets form the foundation of the asset turnover ratio. To grasp the ratio’s significance fully, we need to understand what assets entail in the context of financial analysis and how they contribute to the calculation.
Defining assets
Assets are the fundamental building blocks of any organization’s financial structure, representing all tangible and intangible possessions that hold economic value. To gain a comprehensive grasp of the asset turnover ratio, it is essential to dissect the concept of assets within the realm of financial analysis. Assets can be broadly categorized into two main groups:
Current assets
Current assets are the lifeblood of a company’s day-to-day operations, as they encompass resources that are expected to be either converted into cash or utilized within a relatively short timeframe, typically within one year. These assets are highly liquid and play a pivotal role in ensuring the company’s smooth functioning. Some common examples of current assets include:
- Cash
The most liquid of all assets, cash provides immediate spending power for a company. It includes physical cash on hand and cash equivalents, which are highly liquid investments such as money market funds. - Accounts Receivable
These represent amounts owed to the company by its customers. Accounts receivable arise from credit sales, and their conversion into cash is imminent. - Inventory
Inventory consists of goods and materials held for future sale or production. It includes raw materials, work-in-progress items, and finished goods.
Fixed assets (Non-current assets)
Fixed assets, often referred to as non-current assets, are the long-term assets of a company with a useful life that typically exceeds one year. These assets are vital for the company’s sustained growth and operational efficiency. Fixed assets encompass a diverse range of items, but some common examples include:
- Property
Real estate and land owned by the company fall under this category. Property can be used for operational purposes or as an investment. - Plant
Industrial machinery, equipment, and infrastructure required for manufacturing and production processes are considered plant assets. These assets facilitate the creation of goods and services. - Equipment
This category includes tools and machinery used in various business activities. It ranges from computers and office furniture to heavy industrial machinery.
Incorporating current and fixed assets
Both current and fixed assets play pivotal roles in calculation the asset turnover ratio. The significance of incorporating both categories lies in providing a holistic assessment of a company’s asset utilization efficiency.
As mentioned, at the heart of the asset turnover ratio is the concept of average total assets. This metric represents the average value of all assets deployed by the company during a specific accounting period. With both current and fixed assets considered in this calculation, the ratio accounts for the dynamism of a company’s asset base over time.
Analyzing the asset turnover ratio
Now that we have a solid foundation in asset turnover and how assets contribute to the ratio, let’s explore the ratio’s significance and interpretation.
Interpreting the asset turnover ratio
The asset turnover ratio serves as a valuable tool for investors and financial analysts seeking insights into a company’s operational efficiency and financial performance. Whether high or low, this ratio offers valuable information when interpreted alongside industry benchmarks, helping stakeholders make informed decisions about a company’s financial health and growth potential.
High turnover ratio – the sign of efficient operations
A high asset turnover ratio is a strong indicator that a company is effectively utilizing its assets to generate sales revenue. This is generally regarded as a positive signal in the financial world, as it suggests that the company is maximizing its resources and generating substantial returns on its investments.
To illustrate, let’s consider Company A, which reports a net sales figure of $1 million and an average total asset value of $500,000. In this case, Company A’s asset turnover ratio is calculated as follows:
Asset Turnover Ratio = Net Sales / Average Total Assets
Asset Turnover Ratio = $1,000,000 / $500,000
Asset Turnover Ratio = 2
This ratio of 2 signifies that for every dollar invested in assets, Company A generates $2 in sales revenue. High asset turnover ratios are often associated with efficient operations, as they reflect the company’s ability to generate substantial sales without the need for a significant asset base.
Low turnover ratio – indicative of operational inefficiencies
Conversely, a low asset turnover ratio raises concerns about a company’s operational efficiency. It suggests that the company might not be utilizing its assets optimally, potentially due to various factors such as excess inventory, underutilized production capacity, or ineffective management of accounts receivable.
Let’s take Company B as an example. It reports net sales of $1 million but maintains an average total asset value of $1.5 million, resulting in an asset turnover ratio of 0.67:
Asset Turnover Ratio = Net Sales / Average Total Assets
Asset Turnover Ratio = $1,000,000 / $1,500,000
Asset Turnover Ratio = 0.67
In this scenario, Company B generates only $0.67 in sales for every dollar invested in assets. A ratio below industry norms can be indicative of operational inefficiencies, potentially signaling the need for better asset management and resource allocation.
Benchmarking asset turnover ratios: industry-specific considerations
Effectively evaluating a company’s asset turnover ratio requires considering industry benchmarks and norms. Different industries exhibit varying levels of asset intensity, which means what constitutes a high or low asset turnover ratio can vary significantly across sectors.
For instance, industries like retail and technology typically have higher asset turnover ratios due to their business models, which involve rapid asset turnover. These companies often maintain minimal assets compared to their sales revenue. On the other hand, capital-intensive industries like manufacturing may report lower asset turnover ratios due to their substantial investments in fixed assets, such as machinery and infrastructure.
To draw meaningful conclusions from the asset turnover ratio, it’s crucial to compare a company’s ratio with industry peers and assess its performance in the context of its specific sector. This benchmarking approach provides a more accurate assessment of whether a company’s asset utilization aligns with industry standards and expectations.
Impact on net profit
The connection between the asset turnover ratio and a company’s net profit is a crucial aspect of financial analysis. Understanding how these two metrics are intertwined can provide valuable insights into a company’s financial performance.
The link between asset turnover ratio and net profit may not be immediately apparent. So, to illustrate this relation, let’s consider how an increase in the asset turnover ratio can impact a company’s net profit.
A higher asset turnover ratio is often associated with improved profitability. Here’s how it works:
- Efficient asset utilization
A high asset turnover ratio signifies efficient asset utilization. When a company can generate more sales from the same or fewer assets, it reduces the costs associated with maintaining and financing those assets. - Cost reduction
Reduced asset-related costs, such as depreciation and interest expenses, contribute to higher net profit margins. As a result, the company’s net profit increases.
For example, imagine Company C, a manufacturing firm, with an asset turnover ratio of 1.5. This means that for every $1 of assets, it generates $1.50 in sales. Now, suppose Company C finds ways to optimize its production processes and increase its asset turnover ratio to 2. In this scenario, it’s utilizing its assets more efficiently, leading to a reduction in asset-related costs.
As a result:
- Depreciation expenses remain constant, but their impact per dollar of sales decreases.
- Interest expenses (if any) per dollar of sales decline as well.
The outcome is a higher net profit margin. This improved profitability can make the company more attractive to investors and lenders.
Factors influencing asset turnover ratios
The asset turnover ratio is a dynamic metric influenced by various internal and external factors. Understanding these influences is essential for a holistic assessment of a company’s financial health.
Internal factors
- Sales volume
One of the most direct factors affecting the asset turnover ratio is the company’s sales volume. An increase in sales, while keeping assets relatively stable, leads to a higher asset turnover ratio. - Asset management
Efficient management of assets can significantly impact the ratio. Effective inventory management, for instance, can reduce the amount of tied-up capital in unsold products. - Industry dynamics
Different industries inherently have varying asset turnover ratios due to their unique operational requirements and characteristics.
External factors
- Economic conditions
Economic fluctuations can impact a company’s sales, affecting its asset turnover ratio. During economic downturns, sales may decline, leading to a lower ratio. - Competitive landscape
Competitive pressures can influence pricing and sales strategies, impacting a company’s asset turnover. - Technological advancements
The adoption of new technologies can enhance productivity and, consequently, asset turnover ratios. Conversely, failure to adapt may lead to a decline.
Final word
In conclusion, the asset turnover ratio is a fundamental metric in financial analysis that provides insights into a company’s operational efficiency and profitability. By measuring a company’s ability to generate sales from its assets, this ratio offers investors and analysts a valuable tool for evaluating a company’s financial health.
Assets, whether current or fixed, play a pivotal role in the calculation of the asset turnover ratio. Their efficient utilization can lead to higher asset turnover ratios, which, in turn, can positively impact a company’s net profit.
However, it’s important to recognize that asset turnover ratios are not static and can be influenced by various internal and external factors. These factors must be considered when interpreting the ratio and making investment decisions.
As you venture further into the world of finance and investment, keep in mind that the asset turnover ratio is just one piece of the puzzle. To make well-informed decisions, it should be used in conjunction with other financial metrics and a thorough understanding of the industry in which a company operates. By doing so, you’ll be better equipped to unlock the potential of this powerful tool and maximize your returns in the world of finance.
Learn more about TIE ratio and Business bank account for LLC.