
In this guide, you will find out how to track the total of Sales per time period in a few clicks using Synder.
Overview:
What is a Reporting feature in Synder for
Reporting shows you the total of Sales and Expenses per time period and allows you to track when your Sales go down to react immediately. If you have several integrations (like both PayPal and Stripe) you will be able to see the totals for both in Synder instantly!
How to track your total of Sales and Expenses
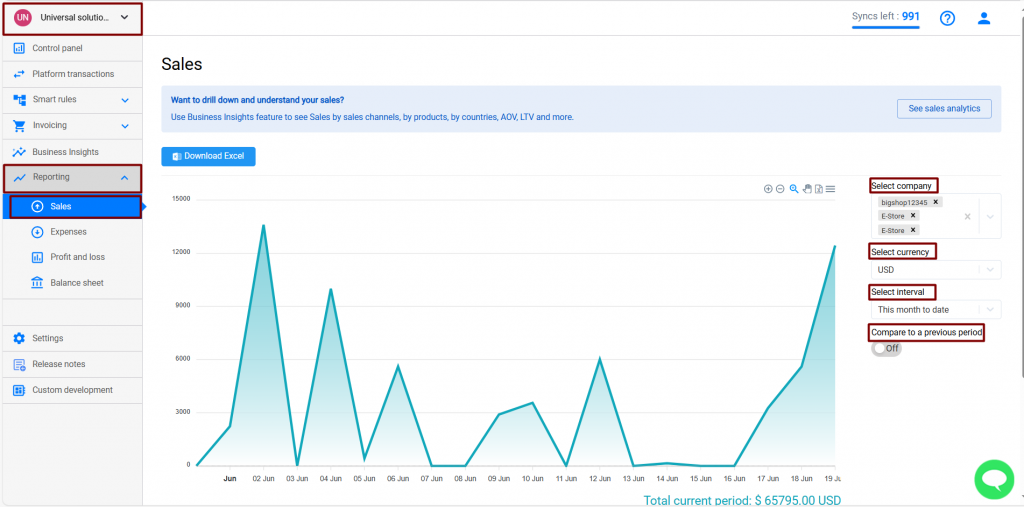
Follow these simple steps to see report of your Sales and Expenses:
- Go to the Reporting tab on the left-hand menu of the Synder page → Sales/Expenses tab.
- Under the Select company tab, choose the Integrations for which you want to see the Report.
- Under the Select currency tab, choose the currency of transactions to include in the report.
- Under the Select interval tab, choose the time range for the report.
- To compare your current statistic with a previous period, simply enable the Compare to a previous period feature.
Useful tips on Reporting in Synder
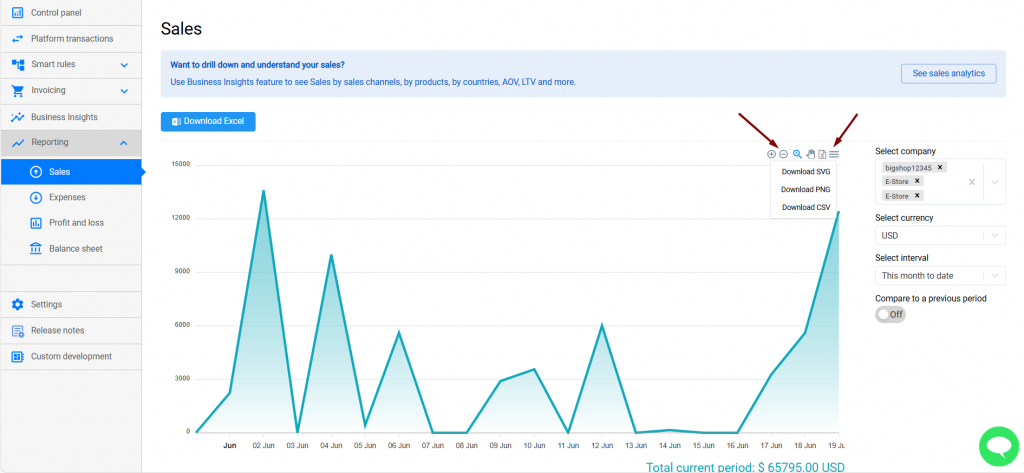
- You can download a report in SVG/PNG/CSV formats. Simply click the Menu button in the upper right corner of the Sales page → select the desired format.
- The report includes all transactions from the Platform transactions tab, whether they were synchronized or not.
- To adjust the scale of the report, use Plus/Minus buttons in the upper right corner of the Sales page.
How to check your Profit and loss and Balance sheet reports
Important note: Profit and loss and Balance sheet reports are currently available for Synder accounting and QuickBooks Online integrations only.
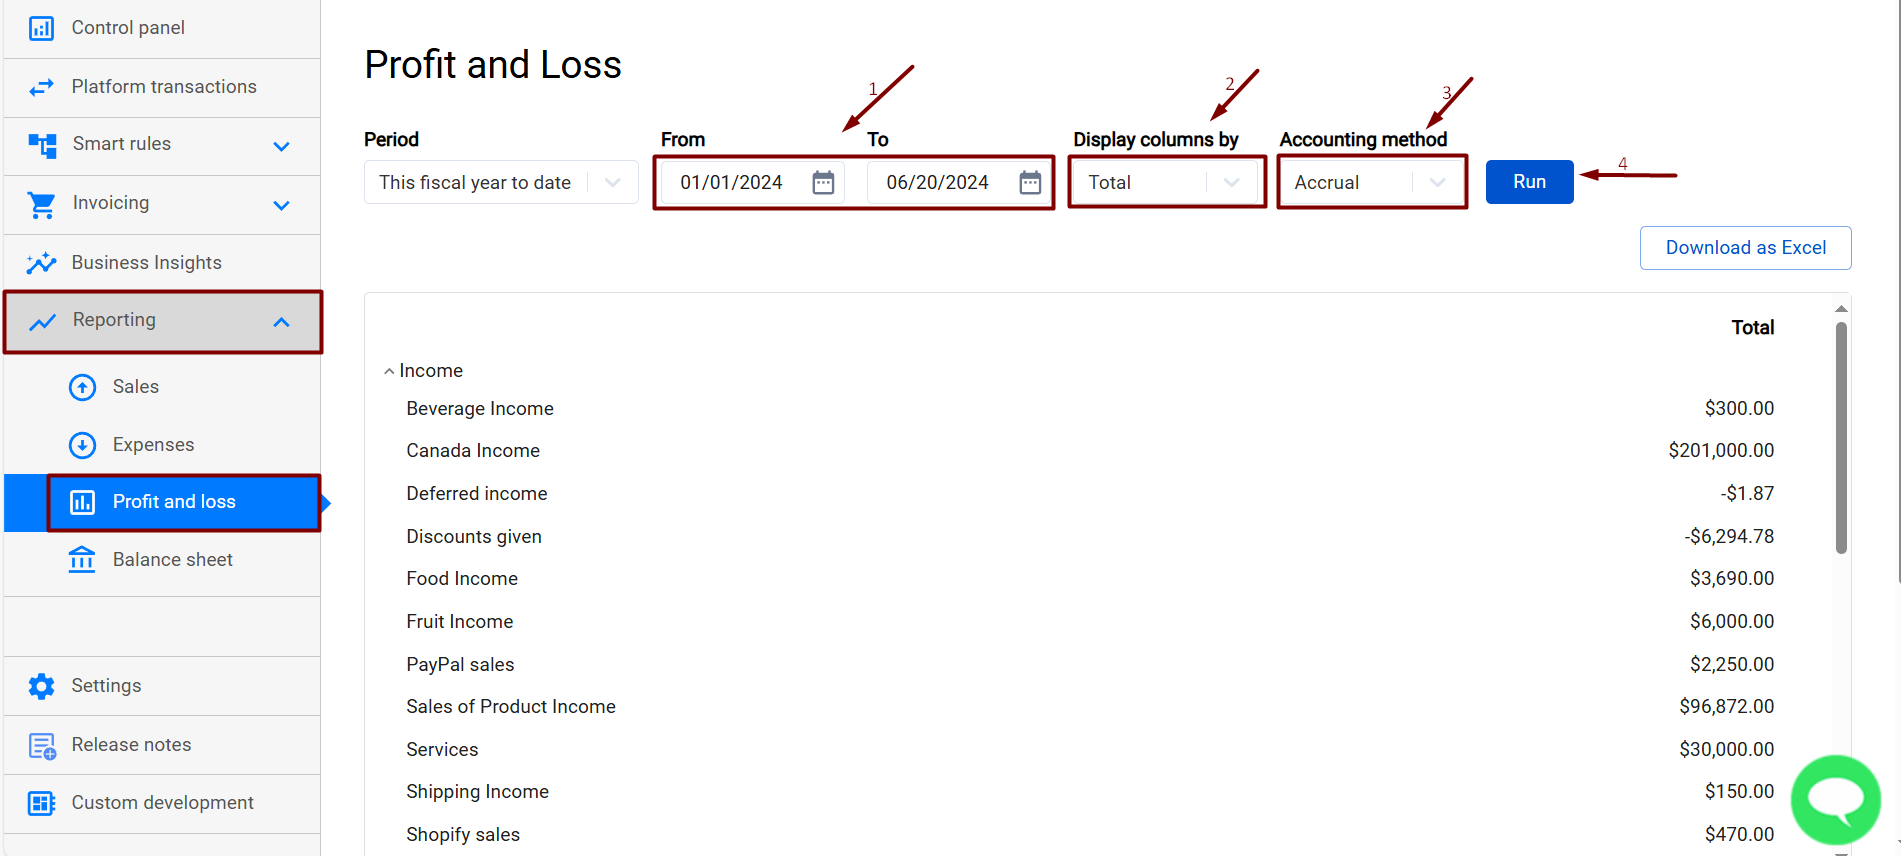
A profit and loss report allows you to check your revenues, costs, and expenses for a specified period.
To check the report in Synder, follow the steps below:
- Go to the Reporting tab on the left-side menu → select Profit and loss;
- Filter the report by the period needed (1), select the way you would like to see a breakdown of columns (classes, departments, days, customers, etc.) – (2), and select the accounting method (3);
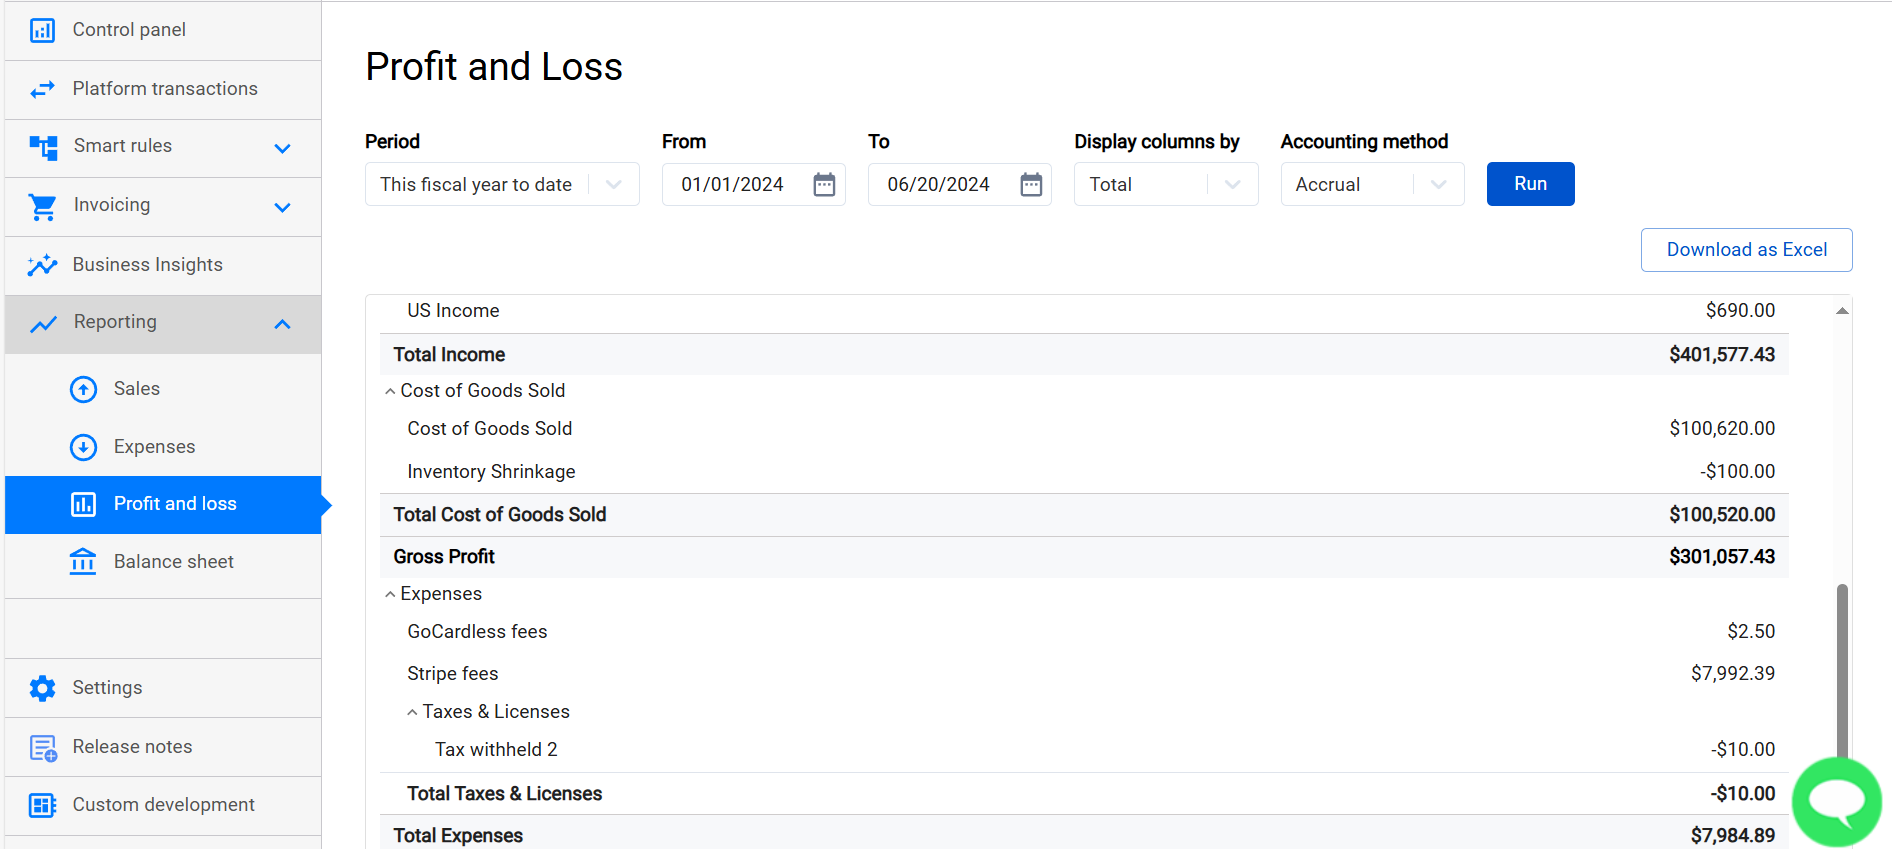
- Run the report.
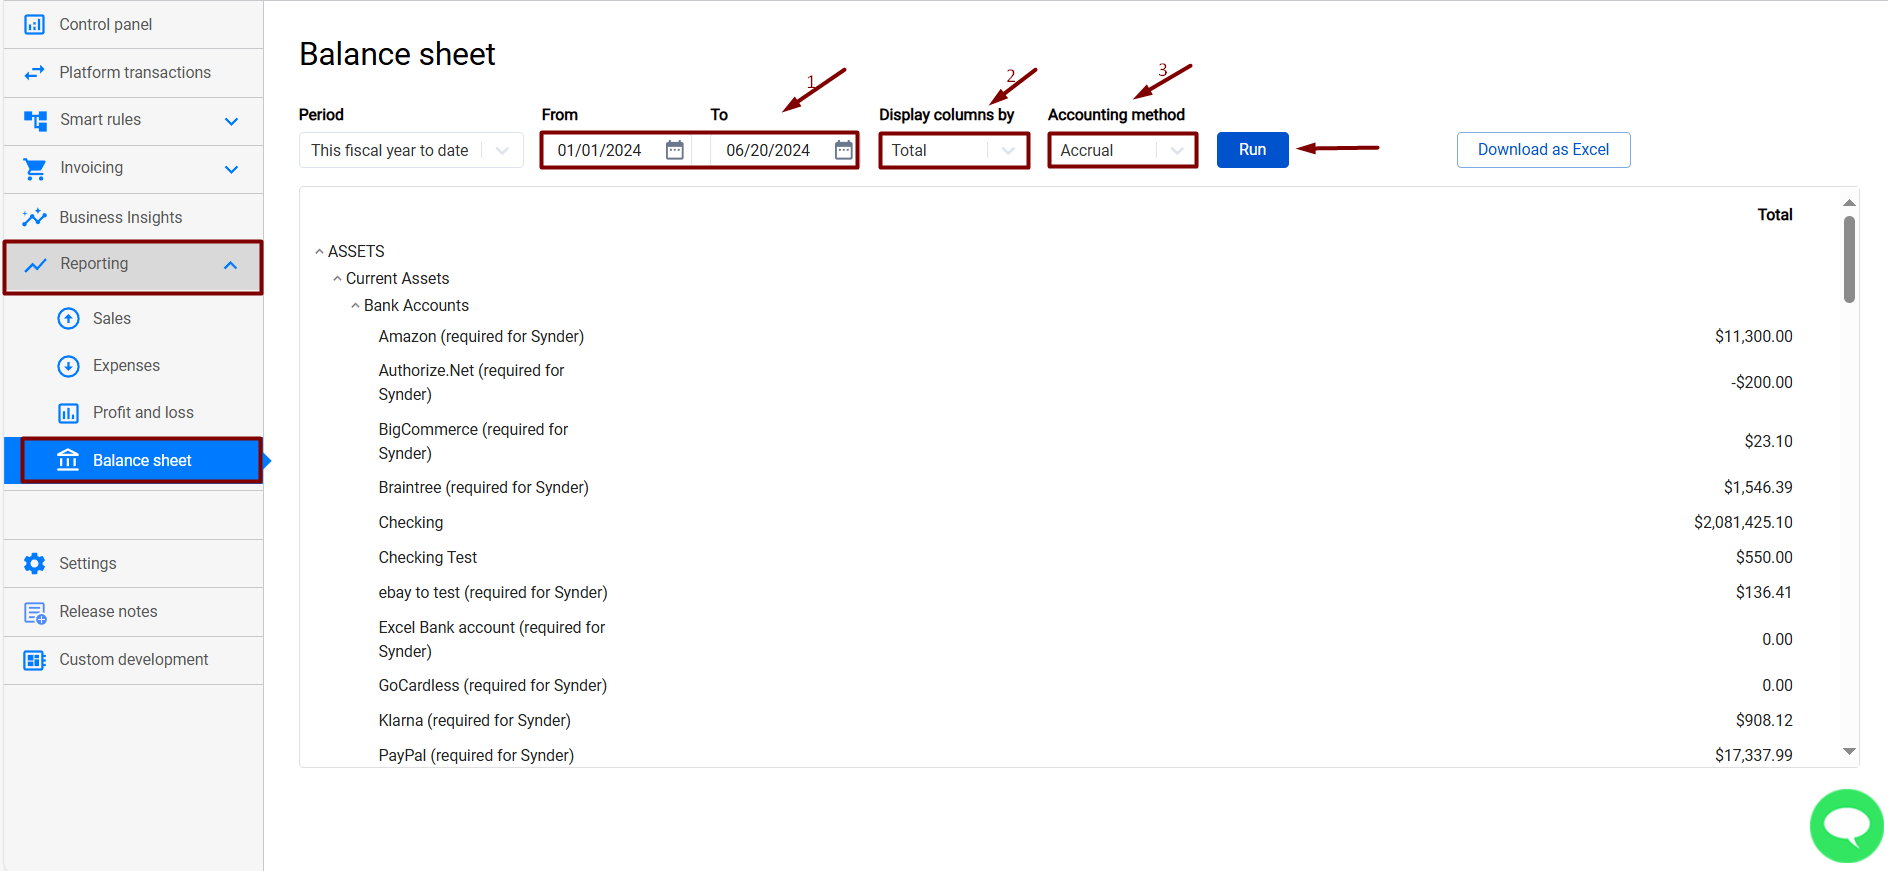
A balance sheet report will provide you with the state of your company’s finances at a moment in time, and you will see your assets, liabilities, and equity.
To check the report in Synder, follow the steps below:
- Go to the Reporting tab on the left-side menu → select Balance sheet;
- Filter the report by the period needed (1), select the way you would like to see a breakdown of columns (classes, departments, days, customers, etc.) – (2), and select the accounting method (3);
- Run the report.
Congratulations! Now you know how to generate reports for your Sales/Expenses, as well as your Profit and Loss and Balance Sheet reports.
Reach out to Synder Team via online support chat, phone, or email with any questions you have – we’re always happy to help you!