Growth is every business’s dream, but expansion is a whole different ball game. With scale come new challenges: managing cash flow, smoothing operations, and protecting profitability. It’s at this stage that businesses find themselves at a crossroads, where smart decisions lead to sustainable success or costly missteps.
Synder’s recent webinar, “5 Key Reports for Strategic Growth on the Expansion Stage,” focused on how businesses can use data-driven strategies to thrive, importance of key financial reports and their role in guiding strategic growth.
Meet the guest speaker

Syed Asad Raza is a finance expert and entrepreneur with more than 15 years of experience helping businesses manage the challenges of growth and expansion. He began his career at Ernst & Young in advisory and assurance, and now he’s running a fractional CFO practice, Syed specializes in leading businesses through the growth phase with data-driven strategies that optimize financial systems and drive sustainable growth.
Let’s discuss these five basic reports and how they can be the building blocks of a business expansion narrative.
Why the expansion stage is a make-or-break moment
Imagine your business as a ship that has set sail. In the early days, you’re so busy patching the leaks and navigating uncharted waters; but now, at the expansion stage, you’re building a fleet. The decisions made at this juncture will define whether your business scales sustainably or runs aground.
The following statistics highlight business failure rates:
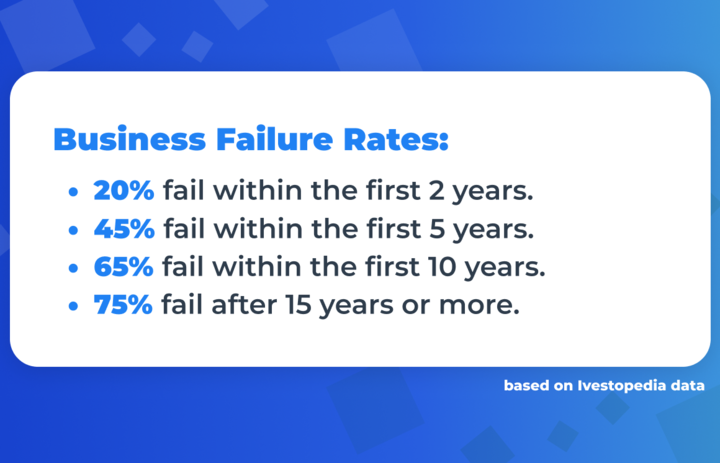
The data speaks for itself, showing that while a large number of businesses can successfully survive the formative years, most face the challenge to continue their growth when at the stage of expansion.
Syed described the expansion stage as a critical point:
“Expansion is that make-or-break stage where companies transition from hustling in the startup phase to scaling sustainably. It’s about building systems, expanding teams, and understanding cash flow and profitability.”
Syed Asad Raza, finance expert
For example, take an ecommerce company that sees an order surge. Without proper systems in place—such as strong inventory management or cash flow forecasting—risks are that they might lose clients due to stockouts or delayed deliveries. Companies need to look ahead, be proactive and react to potential problems based on data-driven insight.
These valuable insights are usually drawn from key reports, which become essential tools in making informed decisions and strategic planning.
1. Cash flow forecast: The north star of business planning
At the heart of any growth plan is one fundamental question: Will we have enough cash to move forward? A cash flow projection answers that question by clearly showing you what your financial future holds.
“A cash flow forecast isn’t just about planning expenses; it’s a roadmap for managing credit cycles, vendor relationships, and operational scalability,” Syed explained.
Take, for instance, a growing wholesale business. When demand for their products suddenly rises, they can rely on a cash-flow forecast to negotiate better terms with suppliers. Matching outgoing payments to expected incoming revenue, the company avoids liquidity freezes and keeps smooth operations.
Not only does the cash flow forecast help with immediate needs, it also sets the stage for long-term planning. It can point out when and where additional funding, such as a credit line, may be needed to support long-term growth initiatives like new warehouse space or marketing campaigns.
2. Income statement: The story of profitability
After clearly understanding your cash flow, the next most important thing to understand is your profitability. The income statement, or profit and loss statement, provides this insight by tracking revenue, expenses, and net income.
“Your income statement tells the story of how revenue cascades down to your bottom line,” Syed said. “It’s essential for understanding gross profit margins, net profit margins, and where operational efficiencies can be improved.”
For example, a construction company in its expansion phase realizes an increase in payroll expenses but not in revenues. From their income statement, they can find out inefficiencies, say, in project management and reallocate them to more profitable projects. This simple adjustment may enable them to increase their net profit margin without adding overhead.
In short, the income statement isn’t simply a financial snapshot but can be used in spotting inefficiencies, improving the pricing strategy, and identifying potential areas for new investment.
3. Forecast-to-actual variance analysis: Closing the gap
Knowing the goals is one thing, attaining them quite another. That is where forecast-to-actual variance analysis comes in handy. This report compares your forecast figures to the real-world actual results, displaying gaps in either planning or implementation.
“Variance analysis helps businesses see if their assumptions were realistic and adjust strategies for future periods,” Syed explained.
One of Syed’s clients, a marketing agency, used variance analysis to understand why their revenue targets were being missed. The analysis showed that underperforming campaigns were eating into profit margins. That insight allowed them to reallocate their marketing budget toward channels with a higher ROI.
By bridging the gap between expectations and reality, variance analysis becomes a powerful instrument for continuous improvement.
4. Break-even analysis: Setting the course
As businesses grow, it’s not just about increasing revenues; it’s about knowing when that growth becomes profitable. A break-even analysis will show you the volume of sales at which you’ll cover your costs, giving a very clear target for growth.
“Understanding your break-even point helps you set realistic sales targets and identify opportunities for cost optimization,” Syed noted.
For example, for a food manufacturing company, break-even analysis may show that outsourcing some of the processes would significantly reduce fixed costs. Meanwhile, a tech startup launching an SDK might use break-even insights to evaluate whether to invest in further feature development or partner integrations based on user adoption rates.. They could work with external vendors to cut costs without compromising on the quality of their products and thereby achieve profitability more quickly.
Break-even analysis enables companies to make informed decisions on how to scale operations, launch new products, or optimize their existing workflows.
5. KPI dashboard: A holistic view of success
In any growing business, there are so many moving parts that it can become overwhelming to keep track of everything. That is where a KPI (key performance indicator) dashboard comes in. This report consolidates all the critical metrics into one view so you can keep track of performance and make data-driven decisions.
“Your KPI dashboard should track key metrics like employee turnover, revenue per employee, and customer lifetime value,” Syed emphasized. “Use it to make informed decisions, not just as a reporting tool.”
Here are some more examples of business KPIs that can be included in a dashboard:
- Revenue growth rate: Measures the percentage increase in revenue over a specific period, showing the overall growth of the business.
- Gross profit margin: Indicates the profitability of products or services, expressing the percentage of revenue after the deduction of COGS.
- Customer acquisition cost (CAC): The sum total of spending to acquire one new customer—helps check the effectiveness of marketing and sales efforts.
- Net promoter score (NPS): Measures customers’ satisfaction and loyalty by asking customers how likely they are to recommend the business to others.
- Debt-to-equity ratio: Evaluates financial leverage by comparing total liabilities to shareholders’ equity, ensuring a balanced capital structure.
- Average order value (AOV): Tracks the average revenue per order, helping identify opportunities to upsell or cross-sell.
- Cash conversion cycle (CCC): Measures how rapidly the business can convert its investment in inventory into cash flow from sales.
Consider an apparel retailer using a KPI dashboard to monitor customer lifetime value (CLV) and marketing efficiency, which might show that some previously loyal customers stopped purchasing. By targeting these customers with personalized campaigns, they can increase repeat purchases and strengthen customer relationships.
In a nutshell, a well-designed KPI dashboard acts as your business compass to keep you on course as you scale.
Next steps: Start leveraging these reports today
Whether you’re a small business taking its first steps toward expansion or a growing company looking to scale further, these five reports can guide your journey. Start by developing a cash flow forecast and income statement, and build from there. With the right data and tools—such as Synder for granular transaction tracking and financial analysis—you’ll be well-equipped to navigate the challenges of the expansion stage.
“Synder is one of the most amazing tools that we have used in our ecommerce side of business, because it helps us break down data on that transaction level and see it whether through Amazon or through the lens of Shopify and how it reflects in our business side. It helps us to do accrual basis of accounting on a much better level.”
Syed Asad Raza, finance expert
Synder: Streamlining financial reporting
Synder helps automate the tracking of financial data by smoothly syncing all transactions from multiple platforms into your accounting software—be it QuickBooks, Xero, or Sage Intacct. It supports over 30 ecommerce platforms and payment gateways, including Shopify, Amazon, Stripe, and PayPal, to make sure that data is consolidated thoroughly.
All transactions are logged with detailed breakdowns, including taxes, fees, and processor charges, in real time. Features like duplicate detection, rollback, and Smart Rules automate categorization and tagging by product type, location, or sales channel, reducing manual work. High-volume businesses benefit from batch processing for swift updates, along with historical data import for accurate reporting.
With Synder, businesses gain GAAP-compliant records, customizable reports like profit and loss statements and balance sheets, and access to KPIs through Synder Insights, offering advanced data-based analytics with a clear view of revenue trends, customer behavior, and sales performance to help businesses make data-driven decisions.
Ready to scale your business with accurate financial reports? Synder may become your ultimate tool! Sign up for a 15-day free trial or join our Weekly Public Demo for more details.
Bringing it all together: The power of data
Each of these reports is instrumental in understanding your business, but combined, they give a full view of your financial health and growth potential. By adopting these tools, businesses end up gaining more than just data; they gain clarity, focus, and the ability to stay agile in a fast-changing market.
Data isn’t just numbers on a page; it’s the story of your business. Use it to spot trends, uncover opportunities, and make decisions that drive strategic growth. By fostering a data-driven culture, you’ll be better equipped to face challenges and seize opportunities with confidence.
For more expert insights and actionable advice, be sure to join future Synder webinars.